How to debug B-U585I-IOT02A board from STM32CubeIDE?
Hi,
I'm trying to get started with the B-U585I-IOT02A board, and I have trouble to debug an application on the board.
So far I managed to do the following:
- Connected via USB to the CN8 USB port on the board to my Windows 11 machine.
- Tried the out-of-the-box B-U585I-IOT02A compiled demo binary, which works as expected.
- Updated ST-LINK firmware on the board via the STSW-LINK007 tool.
- Installed the ST-LINK USB driver on my Windows 11 machine via the STSW-LINK009 tool.
- Installed STM32CubeIDE Version: 1.9.0.
- Imported the example project IOT_HTTP_WebServer that is the source for the out-of-the-box application on the board.
- Made a small change to the application and built it in Debug mode.
- Used STM32CubeProgrammer v2.10.0 to upload the .hex file to the board.
- Verified that my change appears in the application.
So far so good. What I cannot get to work is uploading and debugging an application from STM32CubeIDE. I'm trying to do that with the IOT_HTTP_WebServer project.
So the first question is: Should it be possible to program and debug the B-U585I-IOT02A board over an USB cable that is attached to the "STLINK-V3E USB port (CN8)"? In the user manual it says:
"There are two different ways to program and debug the onboard STM32 MCU:
• Using the STLINK-V3E programming and debugging tool integrated on the B-U585I-IOT02A Discovery kit
• Using an external debug tool connected to CN9 MIPI‑10 connector"
I think that the first option refers to the CN8 USB port, but it is not 100% clear to me.
So assuming that this should work I tried to run or debug the IOT_HTTP_WebServer application by right-clicking the project in STM32CubeIDE Project Explorer and selecting "Debug as..." -> "STM32 Cortex-M C/C++ Application". In the "Edit launch configuration properties" dialog that pops up I leave all the default settings:
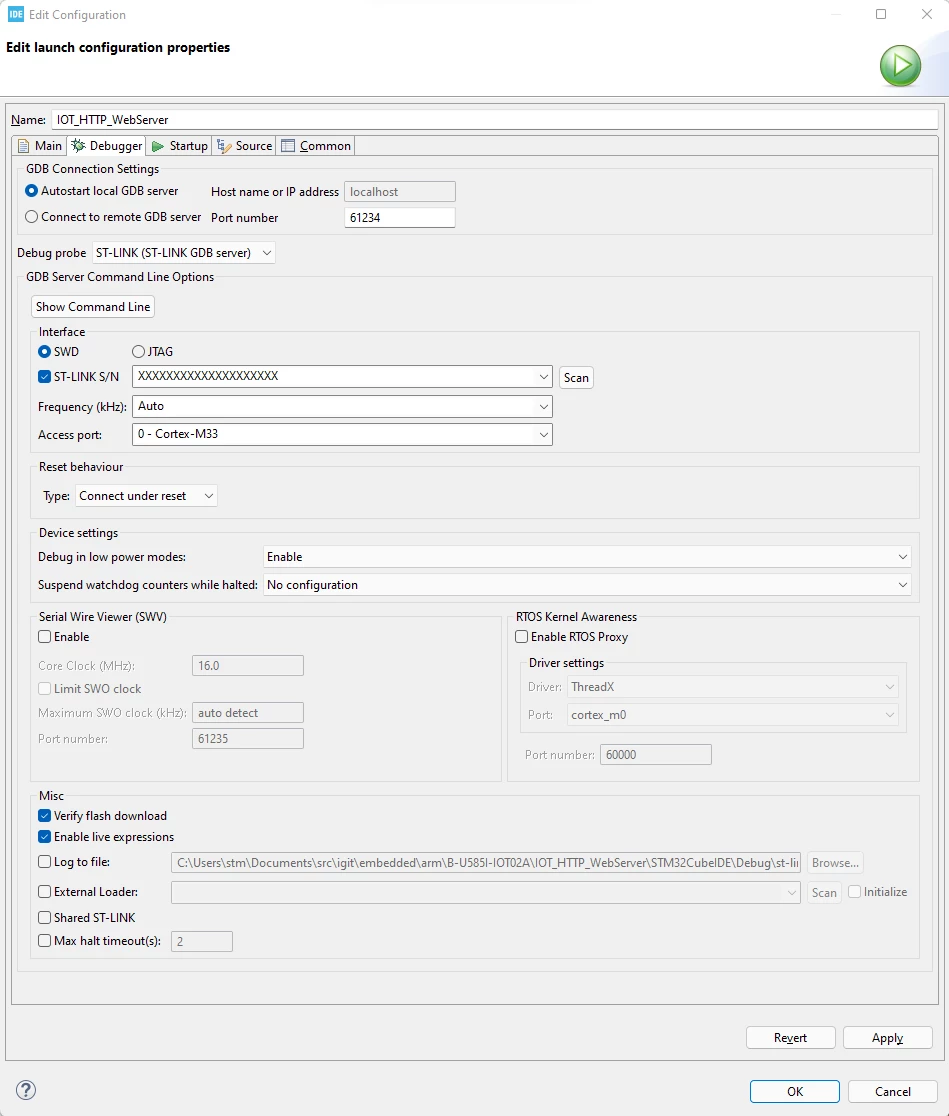 I can click on the ST-LINK S/N check box and click "Scan", and a serial number appears, so the connection appears to be working. I replaced the serial numbers manually with XXXXXX only for the screen shot.
When I then click ok I can see the the red LED next to the CN8 USB connector on the board flashes twice in green, and then an error message pops up with the text:
Error in final launch sequence:
Failed to start GDB server
Failed to start GDB server
Error in initializing ST-LINK device.
Reason: (0) Unknown. Please check power and cabling to target.
And in the Console view I see the following:
STMicroelectronics ST-LINK GDB server. Version 6.1.0
Copyright (c) 2022, STMicroelectronics. All rights reserved.

Starting server with the following options:
 Persistent Mode : Disabled
 Logging Level : 1
 Listen Port Number : 61234
 Status Refresh Delay : 15s
 Verbose Mode : Disabled
 SWD Debug : Enabled
 InitWhile : Enabled

Failed to bind to port 61235, error code -1: No error
Failure starting SWV server on TCP port: 61235
Failed to bind to port 61234, error code -1: No error
Failure starting GDB server: TCP port 61234 not available.
Shutting down...
Exit.
The behavior changes somewhat when I select Debug probe "ST-LINK (OpenODC)" in the Debugger settings in the run configuration. When I run the application with this setting, the LED next to the CN8 port flashes for a longer time, and I see this in the Console view:
Open On-Chip Debugger 0.11.0+dev-00443-gcf12591 (2022-02-09-13:33) [ST Internal]
Licensed under GNU GPL v2
For bug reports, read
	http://openocd.org/doc/doxygen/bugs.html
clock_config
Info : Listening on port 6666 for tcl connections
Info : Listening on port 4444 for telnet connections
Info : STLINK V3J9M3 (API v3) VID:PID 0483:374E
Info : Target voltage: 3.327163
Info : clock speed 8000 kHz
Info : stlink_dap_op_connect(connect)
Info : SWD DPIDR 0x0be12477
Info : STM32U585AIIx.cpu: Cortex-M33 r0p4 processor detected
Info : STM32U585AIIx.cpu: target has 8 breakpoints, 4 watchpoints
Info : STM32U585AIIx.cpu: external reset detected
Info : gdb port disabled
Info : starting gdb server for STM32U585AIIx.cpu on 3333
Info : Listening on port 3333 for gdb connections
Info : accepting 'gdb' connection on tcp/3333
CPU in Non-Secure state
target halted due to debug-request, current mode: Thread
xPSR: 0xf9000000 pc: 0x08001b80 msp: 0x200c0000
STM32U585AIIx.cpu TrustZone disabled
STM32U585AIIx.cpu work-area address is set to 0x20000000
Info : device idcode = 0x20016482 (STM32U57/U58xx - Rev X : 0x2001)
Info : TZEN = 0 : TrustZone disabled by option bytes
Info : RDP level 0 (0xAA)
Info : flash size = 2048kbytes
Info : flash mode : dual-bank
Info : device idcode = 0x20016482 (STM32U57/U58xx - Rev X : 0x2001)
Info : TZEN = 0 : TrustZone disabled by option bytes
Info : RDP level 0 (0xAA)
Info : flash size = 2048kbytes
Info : flash mode : dual-bank
Info : device idcode = 0x20016482 (STM32U57/U58xx - Rev X : 0x2001)
Info : TZEN = 0 : TrustZone disabled by option bytes
Info : RDP level 0 (0xAA)
Info : OTP size is 512 bytes, base address is 0x0bfa0000
Info : New GDB Connection: 1, Target STM32U585AIIx.cpu, state: halted
O.K.

O.K.:0xE00FEFD0

Info : accepting 'gdb' connection on tcp/3333
target halted due to debug-request, current mode: Thread
xPSR: 0xf9000000 pc: 0x08001b80 msp: 0x200c0000
Info : New GDB Connection: 2, Target STM32U585AIIx.cpu, state: halted
target halted due to debug-request, current mode: Thread
xPSR: 0xf9000000 pc: 0x08001b80 msp: 0x200c0000
Info : Padding image section 0 at 0x0818b608 with 8 bytes (bank write end alignment)
target halted due to debug-request, current mode: Thread
xPSR: 0xf9000000 pc: 0x08001b80 msp: 0x200c0000
Info : dropped 'gdb' connection
Info : dropped 'gdb' connection
shutdown command invoked
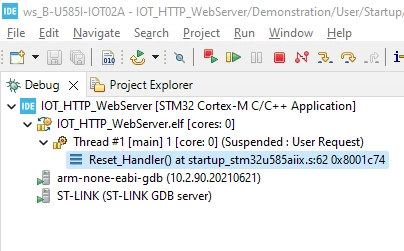
The application is then stopped with the following call stack:
Thread #1 (Suspended : User Request)
	Reset_Handler() at startup_stm32u585aiix.s:62 0x8001b80
When I resume the application, it continues for a few seconds and then STM32CubeIDE says the application has terminated, while the LED next to the CN8 USB connector keeps flashing in red and green.
What am I doing wrong here?
Thanks
Stephan