Senior
March 16, 2024
Solved

GDB server stop working after update, all others programming resource are OK.

  • March 16, 2024
  • 10 replies
  • 5969 views


After updating to STM32CubeIDE 1.14, I can't program my custom boards or Nucleos. I have tested three Nucleos.

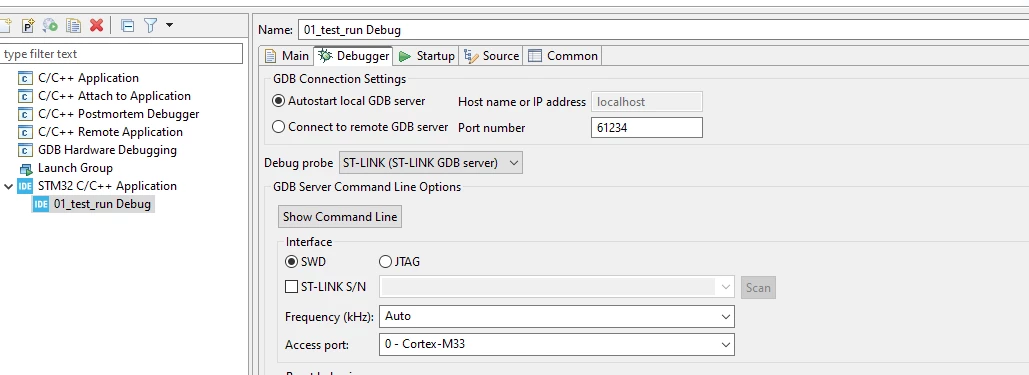
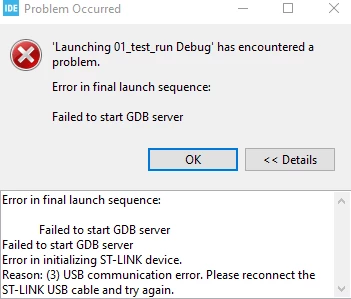
  • Debug probe STL-LINK GDB server -> fails. All custom boards and Nucleos give me the same error, as seen in the image below.

  • Debug probe OpenOCD -> works fine on all boards and Nucleos.

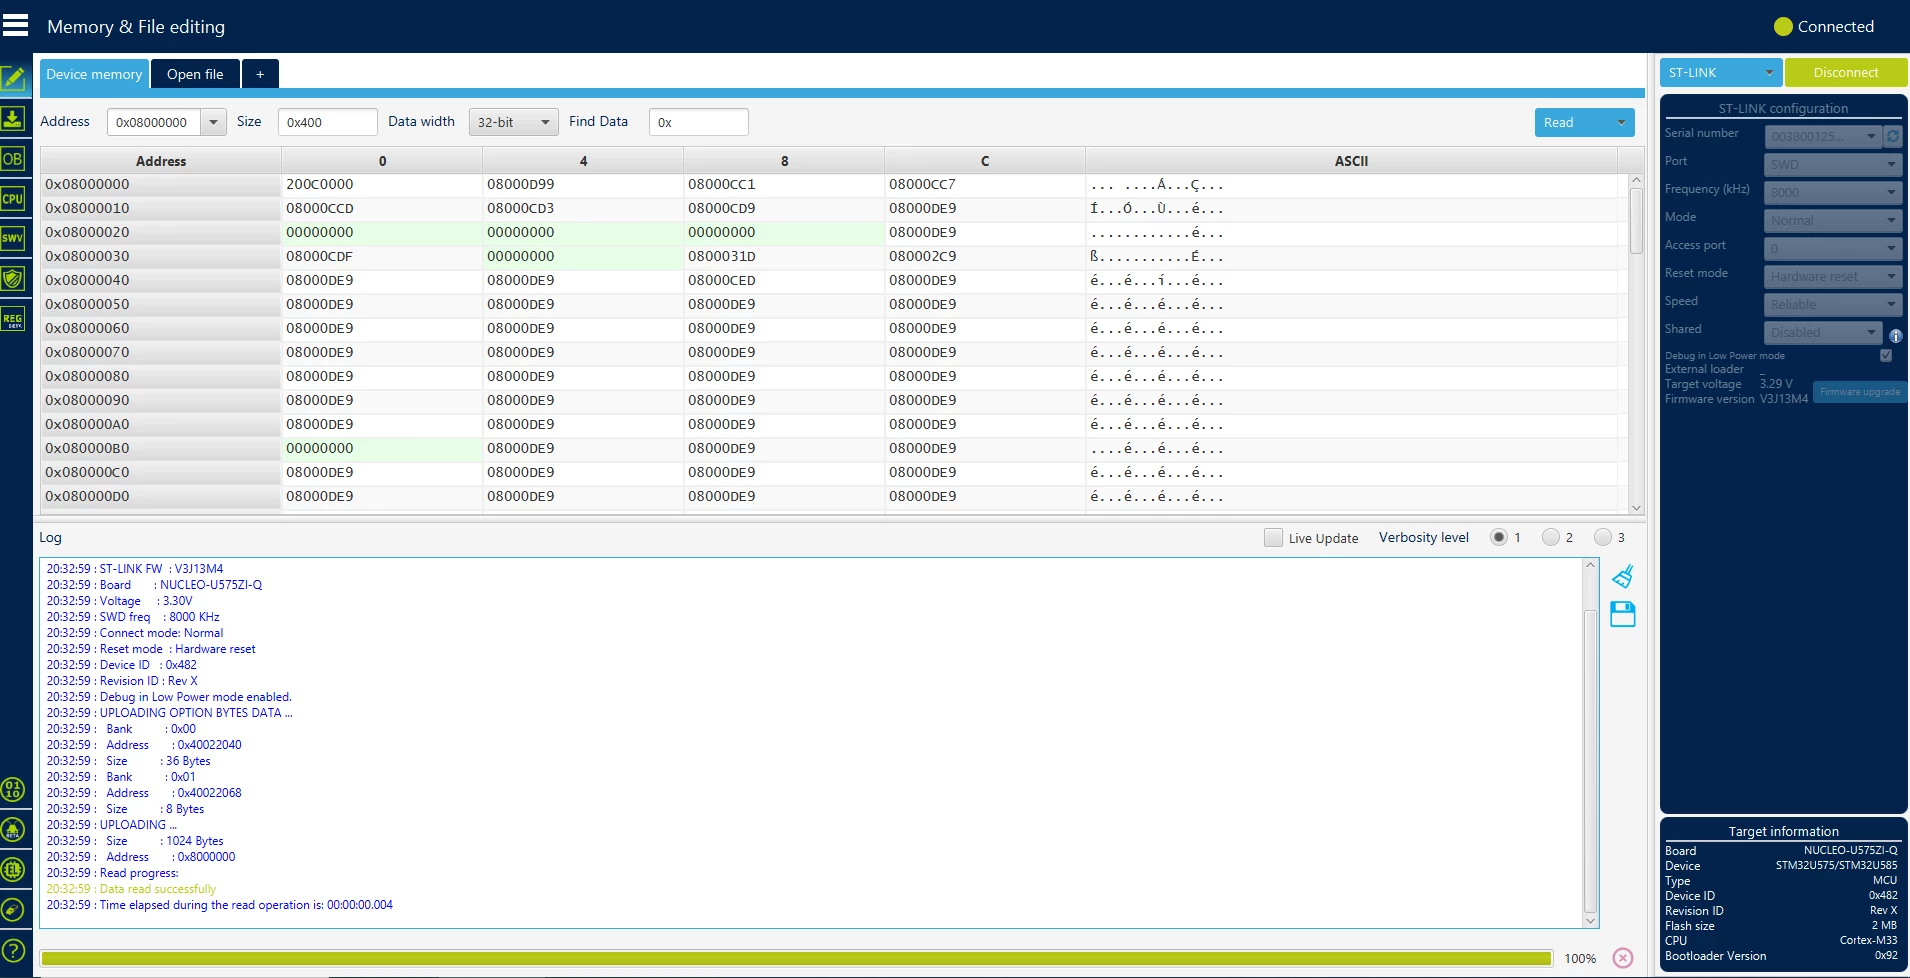
  • STM32CubeProgrammer works fine.

I have reinstalled all programs a couple of times, but I keep getting the same error.

Any ideas?
dhs_2-1710632140558.png

dhs_0-1710631789640.png

dhs_1-1710632015140.png

GDB commad line:

C:\ST\STM32CubeIDE_1.14.1\STM32CubeIDE\plugins\com.st.stm32cube.ide.mcu.externaltools.stlink-gdb-server.win32_2.1.100.202310302101\tools\bin\ST-LINK_gdbserver.exe -p 61234 -l 1 -d -s -cp C:\ST\STM32CubeIDE_1.14.1\STM32CubeIDE\plugins\com.st.stm32cube.ide.mcu.externaltools.cubeprogrammer.win32_2.1.100.202311100844\tools\bin -m 0 -g


st-link_gdbserver_log.txt

[0.000] initConfigParams(): Configuration flags start
[0.000] initConfigParams(): external-init false
[0.000] initConfigParams(): pend-halt-timeout (null)
[0.000] initConfigParams(): halt false
[0.000] initConfigParams(): config-file ""
[0.000] initConfigParams(): persistent false
[0.000] initConfigParams(): +log-file "C:\Users\Gamarra\STM32CubeIDE\workspace_1.14.1\01_test_run\Debug\st-link_gdbserver_log.txt"
[0.001] initConfigParams(): +log-level 31
[0.001] initConfigParams(): +port-number 61234
[0.001] initConfigParams(): +verbose true
[0.001] initConfigParams(): refresh-delay 15
[0.001] initConfigParams(): +verify true
[0.001] initConfigParams(): +swd true
[0.001] initConfigParams(): swo-port 61234
[0.001] initConfigParams(): cpu-clock 8000000
[0.001] initConfigParams(): swo-clock-div 128
[0.001] initConfigParams(): initialize-reset false
[0.001] initConfigParams(): debuggers false
[0.001] initConfigParams(): serial-number ""
[0.001] initConfigParams(): +apid 0
[0.001] initConfigParams(): +attach true
[0.001] initConfigParams(): shared false
[0.001] initConfigParams(): erase-all false
[0.001] initConfigParams(): memory-map ""
[0.001] initConfigParams(): ext-memory-loaders false
[0.001] initConfigParams(): extload_init (null)
[0.001] initConfigParams(): extload (null)
[0.001] initConfigParams(): +stm32cubeprogrammer-path "C:\ST\STM32CubeIDE_1.14.1\STM32CubeIDE\plugins\com.st.stm32cube.ide.mcu.externaltools.cubeprogrammer.win32_2.1.100.202311100844\tools\bin"
[0.001] initConfigParams(): temp-path ""
[0.001] initConfigParams(): preserve-temps false
[0.001] initConfigParams(): frequency 0
[0.001] initConfigParams(): licenses false
[0.001] initConfigParams(): ignore-rest false
[0.001] initConfigParams(): version false
[0.001] initConfigParams(): help false
[0.001] initConfigParams(): Configuration flags end


    This topic has been closed for replies.
    Best answer by dhs

    After reinstalling Windows 10, DGB Server is working again.

    10 replies

    Pavel A.
    March 16, 2024

    Try to create new debug configuration for STL-LINK GDB server, rather than reusing configurations created before update.

    dhsAuthor
    Senior
    March 16, 2024

    By the way, I tried:

    • To use different reset modes, software, hardware...

    • Erase the UCs with the STM32CubeProgrammer, erase is off but keep getting the same error.

    • Update the firmware, the last version is successfully flashed but keep getting the same error.

    • Delete the .elf file to create new debug/run configuration.
    Daniel H Sagarra
    Pavel A.
    March 17, 2024

    Try to create new debug configuration, rather than reusing configurations created before update.

    dhsAuthor
    Senior
    March 17, 2024

    Hi Pavel

    I deleted the .elf file, a new one is created when start a new debug/run sesions, it is Ok or I should try something else? After that problem persist.

    dhs_0-1710638039502.png


    Daniel H Sagarra
    Pavel A.
    March 17, 2024

    @dhs Not the .elf file. Create a new debug configuration. Do not delete the old one yet, if you prefer.

    PavelA_0-1710687741745.png


    AScha.3
    Super User
    March 17, 2024

    > Debug probe OpenOCD -> works fine on all boards and Nucleos.

    So why not use this ? (I most times use OpenOCD .)

    +

    > initConfigParams(): cpu-clock 800000

    CPU is at 8M - really ?

    see one of my settings with GDB:

    AScha3_0-1710663633783.png


    If you feel a post has answered your question, please click on " Best Answer ".
    dhsAuthor
    Senior
    March 17, 2024

    Hi Pavel

    I creted a new one and I still getting same error.

    Open PCD workingfine , down the log:


    Open On-Chip Debugger 0.12.0-00024-gc3ff39f8b (2023-06-26-16:51) [https://github.com/STMicroelectronics/OpenOCD]

    Licensed under GNU GPL v2

    For bug reports, read

    http://openocd.org/doc/doxygen/bugs.html

    clock_config

    Info : Listening on port 6666 for tcl connections

    Info : Listening on port 4444 for telnet connections

    Info : STLINK V3J13M4 (API v3) VID:PID 0483:3754

    Info : Target voltage: 3.422163

    Info : clock speed 8000 kHz

    Info : stlink_dap_op_connect(connect)

    Info : SWD DPIDR 0x0be12477

    Info : [STM32U575VITxQ.cpu] Cortex-M33 r0p4 processor detected

    Info : [STM32U575VITxQ.cpu] target has 8 breakpoints, 4 watchpoints

    Info : gdb port disabled

    Info : starting gdb server for STM32U575VITxQ.cpu on 3333

    Info : Listening on port 3333 for gdb connections

    Info : [STM32U575VITxQ.cpu] external reset detected

    Info : accepting 'gdb' connection on tcp/3333

    CPU in Non-Secure state

    [STM32U575VITxQ.cpu] halted due to debug-request, current mode: Thread

    xPSR: 0xf9000000 pc: 0x0800200c msp: 0x200c0000

    STM32U575VITxQ.cpu TrustZone disabled

    STM32U575VITxQ.cpu work-area address is set to 0x20000000

    Info : device idcode = 0x20016482 (STM32U57/U58xx - Rev X : 0x2001)

    Info : TZEN = 0 : TrustZone disabled by option bytes

    Info : RDP level 0 (0xAA)

    Info : flash size = 2048 KiB

    Info : flash mode : dual-bank

    Info : device idcode = 0x20016482 (STM32U57/U58xx - Rev X : 0x2001)

    Info : TZEN = 0 : TrustZone disabled by option bytes

    Info : RDP level 0 (0xAA)

    Info : flash size = 2048 KiB

    Info : flash mode : dual-bank

    Info : device idcode = 0x20016482 (STM32U57/U58xx - Rev X : 0x2001)

    Info : TZEN = 0 : TrustZone disabled by option bytes

    Info : RDP level 0 (0xAA)

    Info : OTP size is 512 bytes, base address is 0x0bfa0000

    Info : New GDB Connection: 1, Target STM32U575VITxQ.cpu, state: halted

    Info : accepting 'gdb' connection on tcp/3333

    Info : New GDB Connection: 2, Target STM32U575VITxQ.cpu, state: halted

    [STM32U575VITxQ.cpu] halted due to debug-request, current mode: Thread

    xPSR: 0xf9000000 pc: 0x0800200c msp: 0x200c0000

    Info : Padding image section 0 at 0x0800ce2c with 4 bytes (bank write end alignment)

    [STM32U575VITxQ.cpu] halted due to debug-request, current mode: Thread

    xPSR: 0xf9000000 pc: 0x0800200c msp: 0x200c0000

    Info : dropped 'gdb' connection

    [STM32U575VITxQ.cpu] halted due to debug-request, current mode: Thread

    xPSR: 0x29000000 pc: 0x08002190 msp: 0x200bffc8

    shutdown command invoked

    Info : dropped 'gdb' connection


    Daniel H Sagarra
    Pavel A.
    March 18, 2024

    Then keep using the OpenOCD backend?  Sorry, I'm of ideas ((

    dhsAuthor
    Senior
    March 18, 2024

    Currently I am using the OpenOCD, I tested same proyect, sames boards in other PCs, and GDB is ok, I am out of ideas too.

    Daniel H Sagarra
    dhsAuthorBest answer
    Senior
    May 1, 2024

    After reinstalling Windows 10, DGB Server is working again.

    Daniel H Sagarra