
Advanced STM32 debugging in Visual Studio Code with IAR C-SPY
Getting started with advanced STM32 debugging in VS Code with IAR C-SPY
Debugging embedded systems gets harder as projects grow.
At some point, breakpoints and variable windows stop being enough. You need to see how your application behaves over time, track down fast bugs, inspect registers in context, and measure what your code is really doing.
If you are building STM32 projects in VS Code, you can do that without leaving your workflow.
STM32Cube for VS Code brings together C/C++ editing, CMake and Ninja builds, Git, and one-click debugging. It also helps teams stay flexible across IDEs and operating systems while keeping CI/CD workflows consistent.Once your STM32 project is running in VS Code, the IAR C-SPY Debug extension adds a professional-grade analysis layer that scales with project complexity. C-SPY is IAR’s advanced debugging and analysis engine for embedded systems.
If you are new to STM32Cube for VS Code, start with ST official guides:
From debugging to system insight
IAR C-SPY goes beyond breakpoints and variable inspection.
With Listwindows, you get a live, spreadsheet-like view of your running target, including:
- Core registers and custom register groups
- Symbolic memory with direct variable navigation
- Live Watch
- ETM/SWO trace
- Functional profiling
- Real-time code coverage
That means you can move from stopping code to understanding system behavior.
Together, STM32Cube for VS Code provides a fast entry point into the STM32 ecosystem, and IAR adds deterministic builds, advanced trace, and deeper analysis for projects that need more visibility.
Install and configure
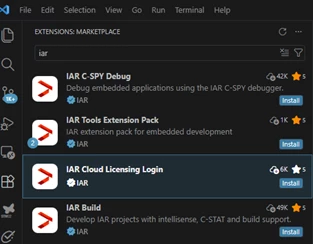
Install the extension from the VS Code Marketplace (@publisher:IAR) and set up the IAR toolchain for Arm. A free evaluation of the IAR Embedded Workbench for Arm is available.
A minimal launch.json configuration for the C-SPY Simulator sets "driver": "Simulator" with --cpu=Cortex®-M4 and --semihosting. Switching to real STM32 hardware is a second configuration with "driver": "ST-LINK", your device (for example --device=STM32F407VG), the matching .ddf file, and --drv_interface=SWD. driverOptions supports the full C-SPY command line with autocomplete inside VS Code.
Real-world debugging examples
- Peripheral issues: create a custom register group (for example SPI), run the application, and see which register or bit changed, and when.
- Memory corruption: monitor variables in Symbolic Memory to catch pointer issues, buffer overruns, stack problems, and RTOS anomalies
- Fast bugs: enable trace, view the timeline, and step backwards using Browse Mode (requires IAR I-jet Trace).
- Coverage and profiling: use instruction-level coverage and functional profiling to measure real runtime behavior.
Get started
Watch the full hands-on walkthrough video and download the example project on IAR’s GitHub repository.
For more information about the IAR VS Code extensions, visit iar.com/vscode.
First published on Jun 09, 2026