

R.M
Associate
November 26, 2019
Question

Plot graph with graph library.
  • November 26, 2019
  • 4 replies
  • 2039 views

0690X00000AsRoBQAV.png

Hi all

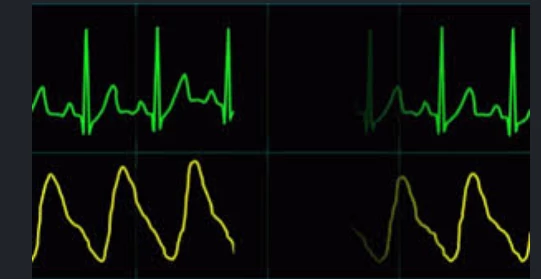
I wanna plot signal graph with graph library but i couldn't put blank space when graph continuously is drawn. The graph method is draw line between old value and new value and it doesn't look beautiful when you see the signal. So i think it would be great if we can add "blank space" same as enclosed image.

 @Martin KJELDSEN (ST Employee) : would you please help me with this?

This topic has been closed for replies.

4 replies

Martin KJELDSEN
Principal III
November 29, 2019

The "blank space" - Is that like a running window?

R.M
R.MAuthor
Associate
November 30, 2019

Yes , a narrow running window that clears a part of graph.

R.M
R.MAuthor
Associate
November 30, 2019

Yes , a narrow running window that clears a part of graph.

R.M
R.MAuthor
Associate
November 30, 2019

Yes , a narrow running window that clears a part of graph.