


Vdoij.1
Associate II
November 23, 2023
Solved

How to Display Time on X-Label in Dynamic Graph

  • November 23, 2023
  • 4 replies
  • 1849 views

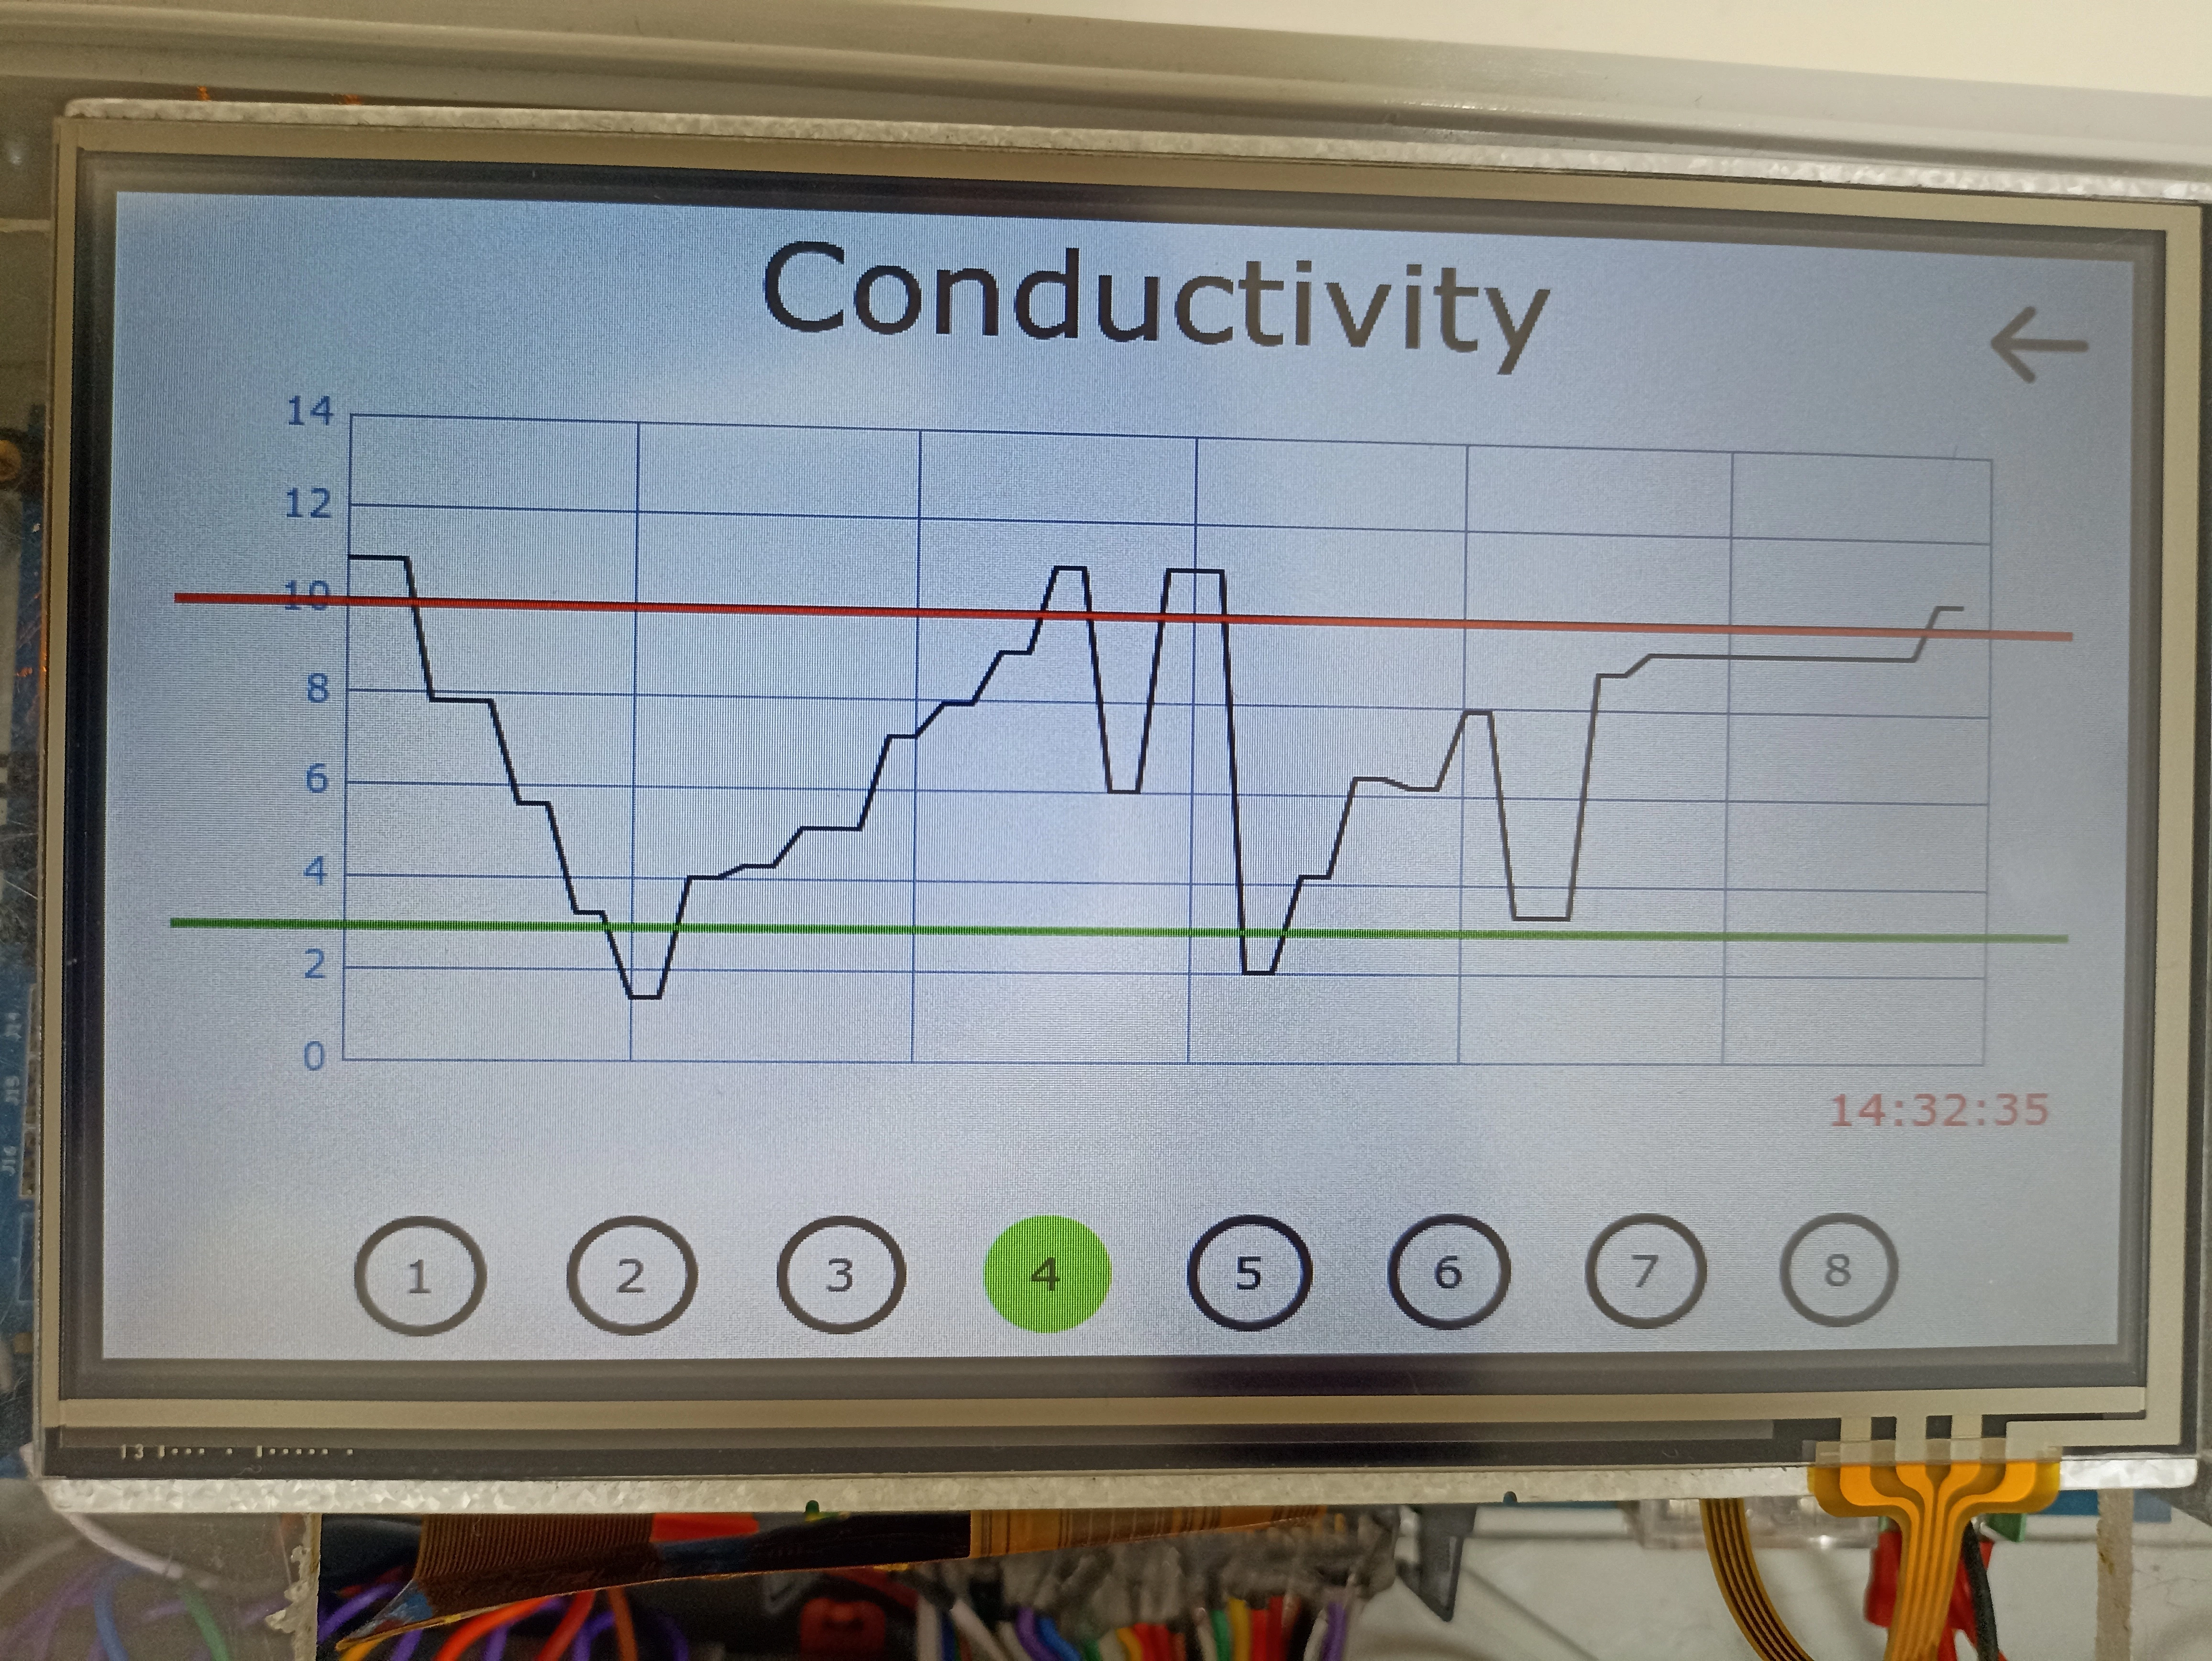
How to Display Time on X-Label in Dynamic Graph instead of incremental integer numbers, I have working RTC date and time which I am displaying on corner of screen. Also my graph is updating as per RTC second update
    This topic has been closed for replies.
    Best answer by Vdoij.1

    IMG_20231207_143418.jpg

    4 replies

    ST Employee
    December 6, 2023

    Hello @Vdoij.1 ,

    Unfortunately, there are no options to have more than one wildcard for the labels. But, you can add text next to values that are shown, for instance, I have added a picture to show how it can be done. 
    Add characters to X-labelAdd characters to X-label

     And for updating your graph every second, you can just add a value to your graph in any time interval you want by using the function addDataPoint() 

    You can read more about graphs here:
    https://support.touchgfx.com/docs/development/ui-development/ui-components/miscellaneous/dynamic-graph

    I hope this helps you

    Mohammad MORADIST Software Developer | TouchGFX
    Vdoij.1
    Vdoij.1Author
    Associate II
    December 6, 2023

    Thnx for reply,

    I simply remove the X-Axis label and display the time in textarea 

    ST Employee
    December 6, 2023

    I see, glad to hear that you figured it out :D

    Mohammad MORADIST Software Developer | TouchGFX
    Vdoij.1
    Vdoij.1AuthorBest answer
    Associate II
    December 7, 2023

    IMG_20231207_143418.jpg