

Associate III
Jun 7, 2024 7:26 AM UTC
Solved

Graph data not showing

Hello.

I would use a static graph to display data. In the handletickevent function, I update the addDataPoint(x data, y data) function for the given page, but nothing appears on the graph, the scale is fine, but no line or change in the x direction can be seen on the display. I am currently using the tickcounter++ variable value for X data, which also increases in debug. For X data, I entered 0min, 200max data in the touchgfx program. I also tried the dynamic graph.

Thanks if anyone can help.
This topic has been closed for replies.
JTP1Best answer
Graduate II
Jun 8, 2024 11:19 AM UTC

Good, Please note that just clearing the static graph doesnt reset the horizontal plotting. You must also reset X coordinate value and start increasing it again from 0 to 200 (if your X range is 0-200).

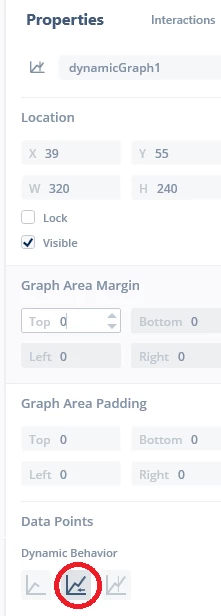
If you need constantly scrolling curve, then dynamic graph is right choice. Select scroll as dynamic behavior:

JTP1_0-1717845201692.png

then just simply add points like


	dynamicGraph1.addDataPoint(some_value);


and graph-widget will place it to first free position (and also scrolls the curve if it is full).

So with dynamic graph you dont have to worry about X values. Naturally using dynamicGraph requires that the x interval of the data points is constant, otherwise the graph will be distorted in the direction of the X-axis.

Br JTP

26 replies

ST Employee
Jun 7, 2024 9:56 AM UTC

Hello @Thomas8607 and welcome to the TouchGFX community !

Can you post your code ?

Regards,

Louis BOUDOST Software Engineer | TouchGFX
Associate III
Jun 7, 2024 10:02 AM UTC

Hello LouisB,

Here is my screen cpp(tickCounter declared in hpp protect) :

LiveDataScreenView::LiveDataScreenView()
{

}

void LiveDataScreenView::setupScreen()
{
 LiveDataScreenViewBase::setupScreen();
 DisplayValues.ActiveScreenNumber = 3;
 tickCounter = 0;
	graph1.clear();
	if(SettingsValues.RadioButtonSelectedItem == 1)
	{
		graph1.setGraphRangeY(0, 300);
		graph1.setScaleY(1);
		graph1MajorYAxisGrid.setInterval(10);
		graph1MajorYAxisGrid.setScale(1);
		graph1MajorYAxisLabel.setInterval(20);
		graph1MajorYAxisLabel.setLabelDecimals(0);
		graph1MajorYAxisLabel.setScale(1);
	}
	else if(SettingsValues.RadioButtonSelectedItem == 2)
	{
		graph1.setGraphRangeY(0, 6000);
		graph1.setScaleY(1);
		graph1MajorYAxisGrid.setInterval(200);
		graph1MajorYAxisGrid.setScale(1);
		graph1MajorYAxisLabel.setInterval(1000);
		graph1MajorYAxisLabel.setLabelDecimals(0);
		graph1MajorYAxisLabel.setScale(1);
	}
	else if(SettingsValues.RadioButtonSelectedItem == 3)
	{
		graph1.setGraphRangeY(-4, 4);
		graph1.setScaleY(10);
		graph1MajorYAxisGrid.setInterval(1);
		graph1MajorYAxisGrid.setScale(10);
		graph1MajorYAxisLabel.setInterval(2);
		graph1MajorYAxisLabel.setLabelDecimals(1);
		graph1MajorYAxisLabel.setScale(10);
	}
	else if(SettingsValues.RadioButtonSelectedItem == 4)
	{
		graph1.setGraphRangeY(0, 9000);
		graph1.setScaleY(1);
		graph1MajorYAxisGrid.setInterval(100);
		graph1MajorYAxisGrid.setScale(1);
		graph1MajorYAxisLabel.setInterval(1000);
		graph1MajorYAxisLabel.setLabelDecimals(0);
		graph1MajorYAxisLabel.setScale(1);
	}
	else if(SettingsValues.RadioButtonSelectedItem == 5)
	{
		graph1.setGraphRangeY(0, 4);
		graph1.setScaleY(10);
		graph1MajorYAxisGrid.setInterval(1);
		graph1MajorYAxisGrid.setScale(10);
		graph1MajorYAxisLabel.setInterval(1);
		graph1MajorYAxisLabel.setLabelDecimals(1);
		graph1MajorYAxisLabel.setScale(10);
	}
	else if(SettingsValues.RadioButtonSelectedItem == 6)
	{
		graph1.setGraphRangeY(0, 4);
		graph1.setScaleY(10);
		graph1MajorYAxisGrid.setInterval(1);
		graph1MajorYAxisGrid.setScale(10);
		graph1MajorYAxisLabel.setInterval(1);
		graph1MajorYAxisLabel.setLabelDecimals(1);
		graph1MajorYAxisLabel.setScale(10);
	}
	else if(SettingsValues.RadioButtonSelectedItem == 7)
	{
		graph1.setGraphRangeY(0, 250);
		graph1.setScaleY(1);
		graph1MajorYAxisGrid.setInterval(5);
		graph1MajorYAxisGrid.setScale(1);
		graph1MajorYAxisLabel.setInterval(25);
		graph1MajorYAxisLabel.setLabelDecimals(0);
		graph1MajorYAxisLabel.setScale(1);
	}
	else if(SettingsValues.RadioButtonSelectedItem == 8)
	{
		graph1.setGraphRangeY(0, 250);
		graph1.setScaleY(1);
		graph1MajorYAxisGrid.setInterval(5);
		graph1MajorYAxisGrid.setScale(1);
		graph1MajorYAxisLabel.setInterval(25);
		graph1MajorYAxisLabel.setLabelDecimals(0);
		graph1MajorYAxisLabel.setScale(1);
	}
}

void LiveDataScreenView::tearDownScreen()
{
 LiveDataScreenViewBase::tearDownScreen();
}
void LiveDataScreenView::handleTickEvent()
{
	tickCounter++;
	HardwareValues.TickCounter = tickCounter; // for debugging
	if (tickCounter % 2 == 0)	// Insert each second tick
	{
		if(SettingsValues.RadioButtonSelectedItem == 1)
		{
			graph1.addDataPoint(tickCounter, 20/*DisplayValues.Speed*/);
		}
		else if(SettingsValues.RadioButtonSelectedItem == 2)
		{
			graph1.addDataPoint(tickCounter, DisplayValues.Rpm);
		}
		else if(SettingsValues.RadioButtonSelectedItem == 3)
		{
			graph1.addDataPoint((float)tickCounter, DisplayValues.Acceleration);
		}
		else if(SettingsValues.RadioButtonSelectedItem == 4)
		{
			graph1.addDataPoint(tickCounter, (uint16_t)DisplayValues.TravelledMeter);
		}
		else if(SettingsValues.RadioButtonSelectedItem == 5)
		{
			graph1.addDataPoint((float)tickCounter, DisplayValues.ImapPressure);
		}
		else if(SettingsValues.RadioButtonSelectedItem == 6)
		{
			graph1.addDataPoint((float)tickCounter, DisplayValues.EmapPressure);
		}
		else if(SettingsValues.RadioButtonSelectedItem == 7)
		{
			graph1.addDataPoint(tickCounter, DisplayValues.IntakeTemp);
		}
		else if(SettingsValues.RadioButtonSelectedItem == 8)
		{
			graph1.addDataPoint(tickCounter, DisplayValues.CoolantTemp);
		}
		graph1.invalidate();
	}
	if(DisplayValues.BootScreenActivate == 1 && DisplayValues.ActiveScreenNumber != 0) {
		static_cast<FrontendApplication*>(Application::getInstance())->gotoBootScreenScreenSlideTransitionEast();
	}
}
void LiveDataScreenView::RadioButtonSet(uint16_t itemSel)
{
	switch(itemSel)
	{
	case 1: radioButtonGroup1.setSelected(radioButton1);
	break;
	case 2: radioButtonGroup1.setSelected(radioButton2);
	break;
	case 3: radioButtonGroup1.setSelected(radioButton3);
	break;
	case 4: radioButtonGroup1.setSelected(radioButton4);
	break;
	case 5: radioButtonGroup1.setSelected(radioButton5);
	break;
	case 6: radioButtonGroup1.setSelected(radioButton6);
	break;
	case 7: radioButtonGroup1.setSelected(radioButton7);
	break;
	case 8: radioButtonGroup1.setSelected(radioButton8);
	break;
	}
}
void LiveDataScreenView::radioButton1Selected()
{
	SettingsValues.RadioButtonSelectedItem = 1;
	ExtEEPROM.writeToEEPROM(RadioButtonSelectedItem_EEPROMADDRESS, SettingsValues.RadioButtonSelectedItem);
	graph1.clear();
	graph1.setGraphRangeY(0, 300);
	graph1.setScaleY(1);
	graph1MajorYAxisGrid.setInterval(10);
	graph1MajorYAxisGrid.setScale(1);
	graph1MajorYAxisLabel.setInterval(20);
	graph1MajorYAxisLabel.setLabelDecimals(0);
	graph1MajorYAxisLabel.setScale(1);
}
void LiveDataScreenView::radioButton2Selected()
{
	SettingsValues.RadioButtonSelectedItem = 2;
	ExtEEPROM.writeToEEPROM(RadioButtonSelectedItem_EEPROMADDRESS, SettingsValues.RadioButtonSelectedItem);
	graph1.clear();
	graph1.setGraphRangeY(0, 6000);
	graph1.setScaleY(1);
	graph1MajorYAxisGrid.setInterval(200);
	graph1MajorYAxisGrid.setScale(1);
	graph1MajorYAxisLabel.setInterval(1000);
	graph1MajorYAxisLabel.setLabelDecimals(0);
	graph1MajorYAxisLabel.setScale(1);
}
void LiveDataScreenView::radioButton3Selected()
{
	SettingsValues.RadioButtonSelectedItem = 3;
	ExtEEPROM.writeToEEPROM(RadioButtonSelectedItem_EEPROMADDRESS, SettingsValues.RadioButtonSelectedItem);
	graph1.clear();
	graph1.setGraphRangeY(-4, 4);
	graph1.setScaleY(10);
	graph1MajorYAxisGrid.setInterval(1);
	graph1MajorYAxisGrid.setScale(10);
	graph1MajorYAxisLabel.setInterval(2);
	graph1MajorYAxisLabel.setLabelDecimals(1);
	graph1MajorYAxisLabel.setScale(10);
}
void LiveDataScreenView::radioButton4Selected()
{
	SettingsValues.RadioButtonSelectedItem = 4;
	ExtEEPROM.writeToEEPROM(RadioButtonSelectedItem_EEPROMADDRESS, SettingsValues.RadioButtonSelectedItem);
	graph1.clear();
	graph1.setGraphRangeY(0, 9000);
	graph1.setScaleY(1);
	graph1MajorYAxisGrid.setInterval(100);
	graph1MajorYAxisGrid.setScale(1);
	graph1MajorYAxisLabel.setInterval(1000);
	graph1MajorYAxisLabel.setLabelDecimals(0);
	graph1MajorYAxisLabel.setScale(1);
}
void LiveDataScreenView::radioButton5Selected()
{
	SettingsValues.RadioButtonSelectedItem = 5;
	ExtEEPROM.writeToEEPROM(RadioButtonSelectedItem_EEPROMADDRESS, SettingsValues.RadioButtonSelectedItem);
	graph1.clear();
	graph1.setGraphRangeY(0, 4);
	graph1.setScaleY(10);
	graph1MajorYAxisGrid.setInterval(1);
	graph1MajorYAxisGrid.setScale(10);
	graph1MajorYAxisLabel.setInterval(1);
	graph1MajorYAxisLabel.setLabelDecimals(1);
	graph1MajorYAxisLabel.setScale(10);
}
void LiveDataScreenView::radioButton6Selected()
{
	SettingsValues.RadioButtonSelectedItem = 6;
	ExtEEPROM.writeToEEPROM(RadioButtonSelectedItem_EEPROMADDRESS, SettingsValues.RadioButtonSelectedItem);
	graph1.clear();
	graph1.setGraphRangeY(0, 4);
	graph1.setScaleY(10);
	graph1MajorYAxisGrid.setInterval(1);
	graph1MajorYAxisGrid.setScale(10);
	graph1MajorYAxisLabel.setInterval(1);
	graph1MajorYAxisLabel.setLabelDecimals(1);
	graph1MajorYAxisLabel.setScale(10);
}
void LiveDataScreenView::radioButton7Selected()
{
	SettingsValues.RadioButtonSelectedItem = 7;
	ExtEEPROM.writeToEEPROM(RadioButtonSelectedItem_EEPROMADDRESS, SettingsValues.RadioButtonSelectedItem);
	graph1.clear();
	graph1.setGraphRangeY(0, 250);
	graph1.setScaleY(1);
	graph1MajorYAxisGrid.setInterval(5);
	graph1MajorYAxisGrid.setScale(1);
	graph1MajorYAxisLabel.setInterval(25);
	graph1MajorYAxisLabel.setLabelDecimals(0);
	graph1MajorYAxisLabel.setScale(1);
}
void LiveDataScreenView::radioButton8Selected()
{
	SettingsValues.RadioButtonSelectedItem = 8;
	ExtEEPROM.writeToEEPROM(RadioButtonSelectedItem_EEPROMADDRESS, SettingsValues.RadioButtonSelectedItem);
	graph1.clear();
	graph1.setGraphRangeY(0, 250);
	graph1.setScaleY(1);
	graph1MajorYAxisGrid.setInterval(5);
	graph1MajorYAxisGrid.setScale(1);
	graph1MajorYAxisLabel.setInterval(25);
	graph1MajorYAxisLabel.setLabelDecimals(0);
	graph1MajorYAxisLabel.setScale(1);
}


Thank you!

Graduate II
Jun 8, 2024 4:36 PM UTC

You're welcome !

Where it was call then...some code that we didin't see ?


Associate III
Jun 8, 2024 4:38 PM UTC

In the second reply, the cpp code. 

Graduate II
Jun 8, 2024 4:53 PM UTC

Yes, I see that for example 'radioButton1Selected'- function clears the graph.. but hows calling it ?

I suppose if you set an interaction to virtual function (radioButton1Selected in this case), it is called only once, when button gets selected.


Associate III
Jun 8, 2024 6:46 PM UTC

Only selected, not clicked. and it runs continuously whatever is selected.
I didn't know this either, so I keep writing the eeprom as well.

Graduate II
Jun 8, 2024 7:14 PM UTC

Okey, I think it should not do that. Which version you use ?

I allready tested this with 4.32.2 because i'm not so familiar with radiobuttons and it does only single call (at least on the simulator).