ksale.1
Senior II
July 31, 2022
Solved

Checking memory usage

  • July 31, 2022
  • 3 replies
  • 1246 views

In the documentation, the file described is generated by IAR embedded workbench. I'm using cubeIDE. Where can I find the mapping file?

This topic has been closed for replies.
Best answer by Yoann KLEIN

Hello,

You have to compile your project to see your .map file.

If you are using STM32CubeIDE, please press the "Build" button :

0693W00000QNNDDQA5.png 

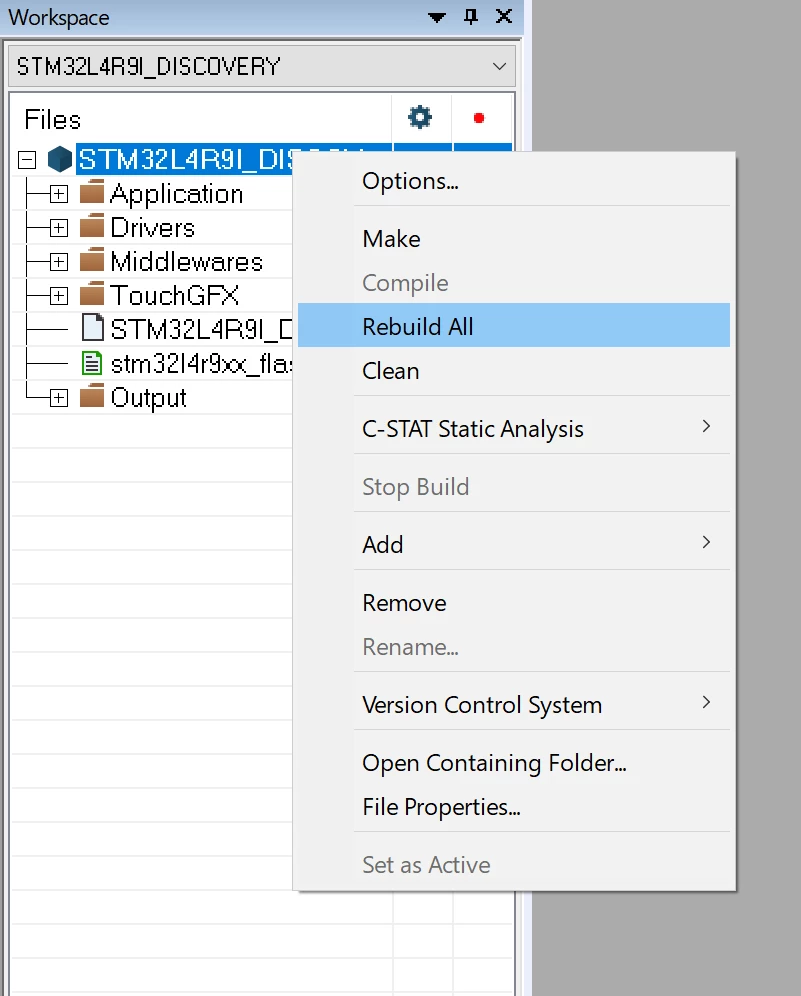
If you use EWARM, press "Rebuild all" after right-clicking your project name :

0693W00000QNNDrQAP.png 

If it compiles successfully, you'll be able to access your map file.

/Yoann

3 replies

Yoann KLEIN
ST Employee
August 8, 2022

Hello @ksale.1​ ,

I'm not sure to understand from which file you are talking about exactly.

If it is the .map file, you can find it at EWARM > "Board Name" > List.

Otherwise, could you please be more specific ?

Thank you !

/Yoann

Yoann KLEINST Software Developer | TouchGFX
ksale.1
ksale.1Author
Senior II
August 10, 2022

Thank you @Yoann KLEIN​ 

Please note the EWARM directory in my case (gfx 4.20.0)

0693W00000QNLQtQAP.png

Yoann KLEIN
Yoann KLEINBest answer
ST Employee
August 10, 2022

Hello,

You have to compile your project to see your .map file.

If you are using STM32CubeIDE, please press the "Build" button :

0693W00000QNNDDQA5.png 

If you use EWARM, press "Rebuild all" after right-clicking your project name :

0693W00000QNNDrQAP.png 

If it compiles successfully, you'll be able to access your map file.

/Yoann

Yoann KLEINST Software Developer | TouchGFX