

Konami
Senior
August 4, 2023
Question

Tracing Source of Double Precision Libs

  • August 4, 2023
  • 9 replies
  • 5650 views

I'm building an application for an STM32G0 and noticed that quite a bit of double precision libs such as _strtod_l, __aeabi_dsub, __aeabi_dadd, etc are shown in the linker file. As far as I know, there is no double math being done but obviously something is requiring it.

In an effort to reduce code size, I'm trying to understand why these are linked and see if I can eliminate them to free up valuable flash. The application is quite large so just removing bits of code is not a light effort and I've tried running objdump -D on all .o files, but I don't see any references in this output. Is there a better way?

Note:

  • -Wdouble-promotion does not report any warnings
  • I've tried to append an 'f' to all fp literals, but I've also enabled -fsingle-precision-constant
  • -fdata-sections, -ffunction-sections, -Wl, --gc-sections are all being used
  • --specs=nano.specs
  • Compiler is GNU Tools for STM32 (10.3-2021-10) included in CubeIDE

From map file analysis:
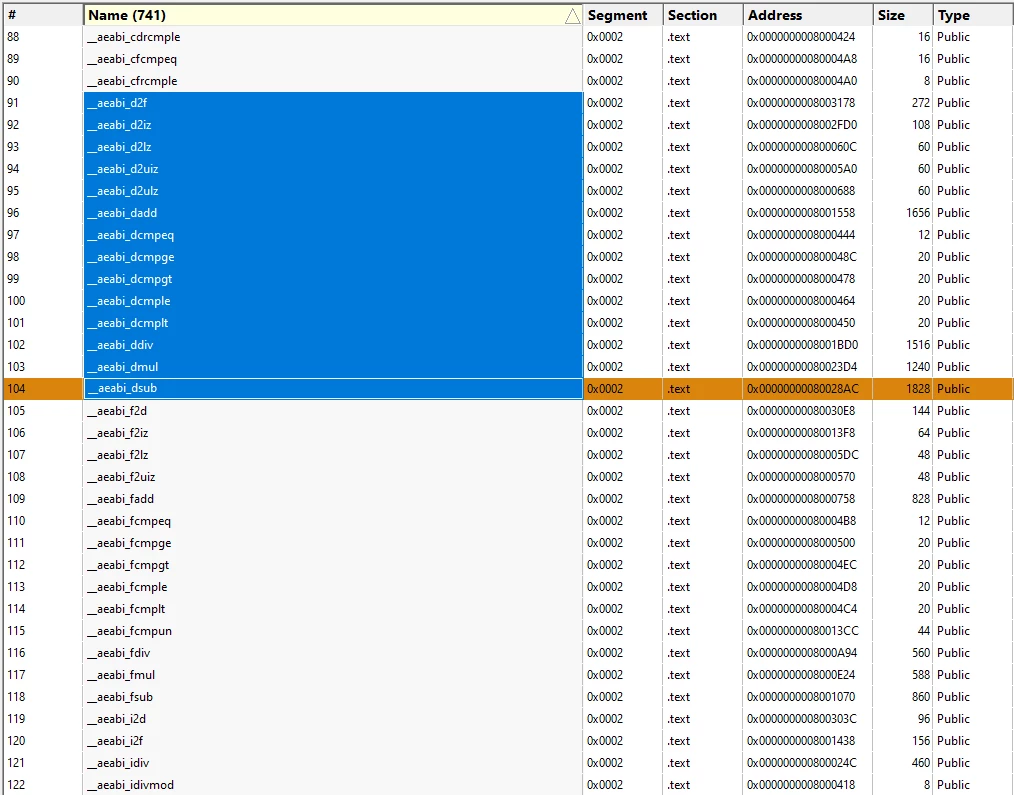
Konami_0-1691183156487.png


This topic has been closed for replies.

9 replies

Tesla DeLorean
Guru
August 4, 2023

Disassemble and cross-reference so you understand what is using them.

printf/scanf likely to be primary culprits unless you use "lite" versions. Watch also for lazy usage of floats in the HAL, say computing UART bauds, or unpacking clock / pll trees.

Tips, Buy me a coffee, or three.. PayPal Venmo (See Profile) Up vote any posts that you find helpful, it shows what's working..
Konami
KonamiAuthor
Senior
August 4, 2023

Sorry, I edited my response just a bit too late. I have tried running objdump -D on all my object files and don't see any references (only __aeabi_f* show up). Am I doing the disassembly wrong or missing something?


Tesla DeLorean
Guru
August 4, 2023

I'm using things a bit more exotic than objdump, but if you have a list of entry points, and the code is linear, you should be able to establish if anything calls them.

There's perhaps some common code among the functions.

Worst case block fill the memory with 0xCDCDCDCD and see what traps out of the HardFault Handler, and back-trace.

Tips, Buy me a coffee, or three.. PayPal Venmo (See Profile) Up vote any posts that you find helpful, it shows what's working..
RhSilicon
Lead
August 4, 2023

I suspect that you are already using the advanced debugging tools, but in any case, I found this video list, I don't know if it helps in your case:

https://youtube.com/playlist?list=PLnMKNibPkDnEDEsV7IBXNvg7oNn3MfRd6

Konami
KonamiAuthor
Senior
August 4, 2023

Thanks, I'll give these a watch to see it there's anything I'm not aware of

RhSilicon
Lead
August 4, 2023
Konami
KonamiAuthor
Senior
August 4, 2023

I'm realizing that if the standard libs are using double libraries under the hood, then disassembling my object files won't reveal that. Is there any way around this?


RhSilicon
Lead
August 4, 2023

The application is quite large

Would it be possible to use baremetal style code? Libraries usually have a lot of useless stuff.


KnarfB
Super User
August 5, 2023

I see a lot of comparison ops. Are you using double constants like 1.0 instead of 1.0f?

gcc linker option that may help:

-trace-symbol=...

If your can debug, set a breakpoint in the debugger console like

break __aeabi_ldiv0

to get a full call stack.

hth

KnarfB
