
How to calculate the worst and the mean execution time of an assembly instruction in the STM32F103?
I have write two simple code examples.
First:
 LDR R0, =0x00000000
 LDR R1, =0x0000FFFF
 LDR R2, =GPIOA_ODR

 turnON:
 STR R1, [R2]
 turnOFF:
 STR R0, [R2]
 delayDone:
 B turnON
Second:
 LDR R0, =0x00000000
 LDR R1, =0x0000FFFF
 LDR R2, =GPIOA_ODR

 turnON:
 STR R1, [R2]
 B turnOFF
 turnOFF:
 STR R0, [R2]
 delayDone:
 B turnON
The first example cause next output: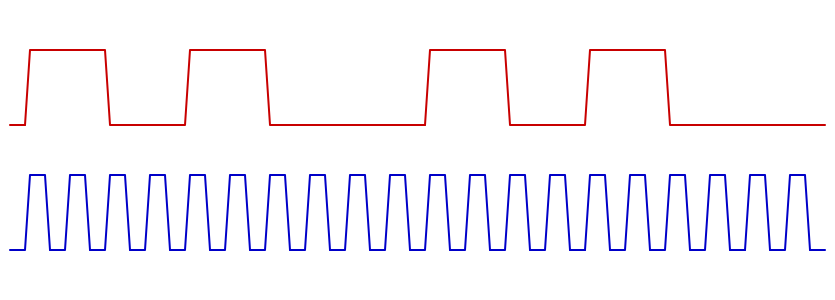 The red plot is the bitbang output, the blue plot is the SYSCLK from MSO
The second example cause next output: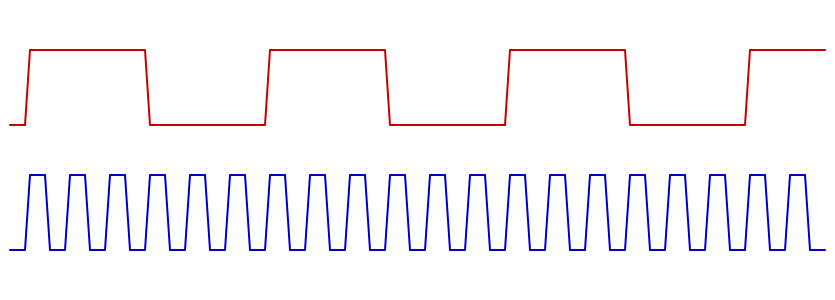 The red plot is the bitbang output, the blue plot is the SYSCLK from MSO
The first example gives a 2-2-2-4 clock bitbang sequence. Respectively we can say that
the best loop execution time is 4 cycles,
the mean loop execution time is 5 cycles,
the worst loop execution time is 6 cycles.
And the second example gives a 3-3-3-3 clock bitbang sequence. Respectively we can say that
the best loop execution time is 6 cycles,
the mean loop execution time is 6 cycles,
the worst loop execution time is 6 cycles.
I understand that this behaviour cause is the branch prediction.
Is it possible to calculate/simulate for some code (such as a macro or a procedure) writed with assembly instructions the worst execution time?
