This topic has been closed for replies.
cedric H
cedric HBest answer
ST Technical Moderator
Jul 2, 2025 2:07 PM UTC

Hi @tej_sri_02 

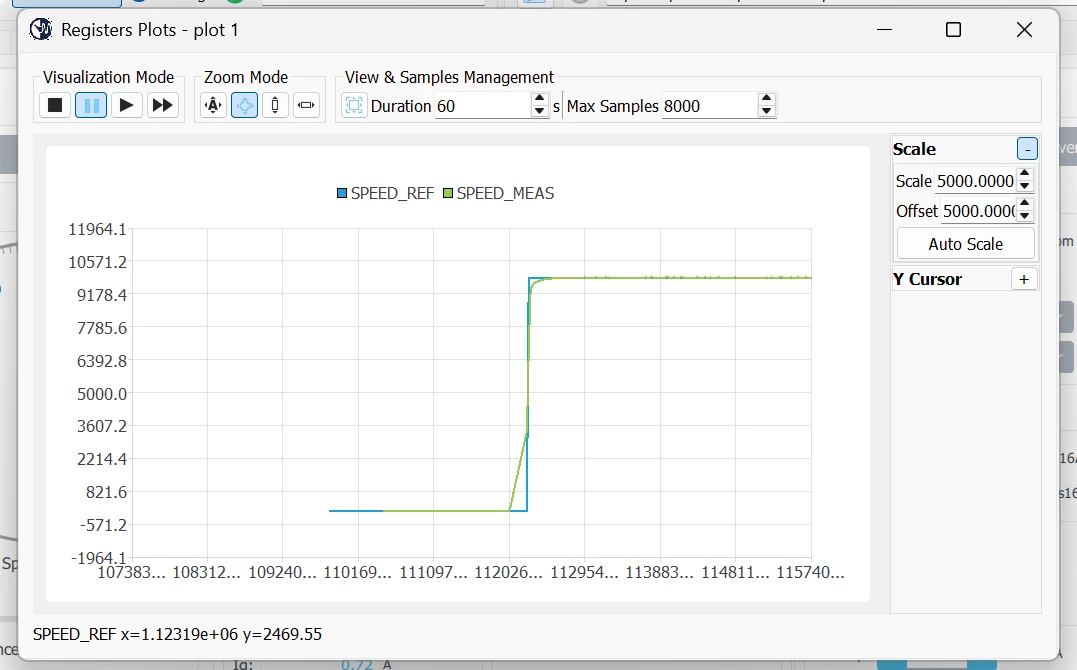
The plot you are looking at is the register plot. It is not a real time plot. The information is collected by a pooling mechanism. Depending on the number of registers you plot, the Pilot will split the reading command into several accesses, that are at least 1 ms spaced, the atomicity is then absolutely not guarantee. On top of that, the MC Pilot draws lines between the various sampled, then at the end you can end up with such kind of artefact.

If you need to do graphical analysis, only the high frequency plot can be a root of trust. It is based on an asynchronous protocol and guarantee that all the data collected come from the same PWM cycle.

But, be assured that the system is always causal, and the answer never physically comes before the command ;) !

Regards

Cedric

4 replies

cedric H
cedric HBest answer
ST Technical Moderator
Jul 2, 2025 2:07 PM UTC

Hi @tej_sri_02 

The plot you are looking at is the register plot. It is not a real time plot. The information is collected by a pooling mechanism. Depending on the number of registers you plot, the Pilot will split the reading command into several accesses, that are at least 1 ms spaced, the atomicity is then absolutely not guarantee. On top of that, the MC Pilot draws lines between the various sampled, then at the end you can end up with such kind of artefact.

If you need to do graphical analysis, only the high frequency plot can be a root of trust. It is based on an asynchronous protocol and guarantee that all the data collected come from the same PWM cycle.

But, be assured that the system is always causal, and the answer never physically comes before the command ;) !

Regards

Cedric

Associate II
Jul 3, 2025 3:36 AM UTC

Hi Cedric,

Thanks for responding. Can we plot Measured and Reference Speed in HF Plot? I can't find corresponding registers of it in the window. Please help.


tej_sri_02_0-1751513758493.png


cedric H
ST Technical Moderator
Jul 3, 2025 9:29 AM UTC

Hi,

Those signals are updated on the medium frequency task, most of the time it is not really interesting to waste bandwidth to dump them in the high frequency plot. The main purpose is to have a global idea of the signal shape.

Now, if you need it, feel free to update the code (you can just replace the pointer of one of the list that you do not use)

Regards

Cedric

Associate II
Jul 3, 2025 9:35 AM UTC

Thanks