

VSøby.1
Associate II
November 26, 2020
Solved

SOLVED - Debugging custom board through ST Link 2 using SWD interface. Fail in launch sequence

  • November 26, 2020
  • 19 replies
  • 8290 views

I am using v 1.5 of STM32CubeIDE, and an ST link v2 running firmware V2J37S7.

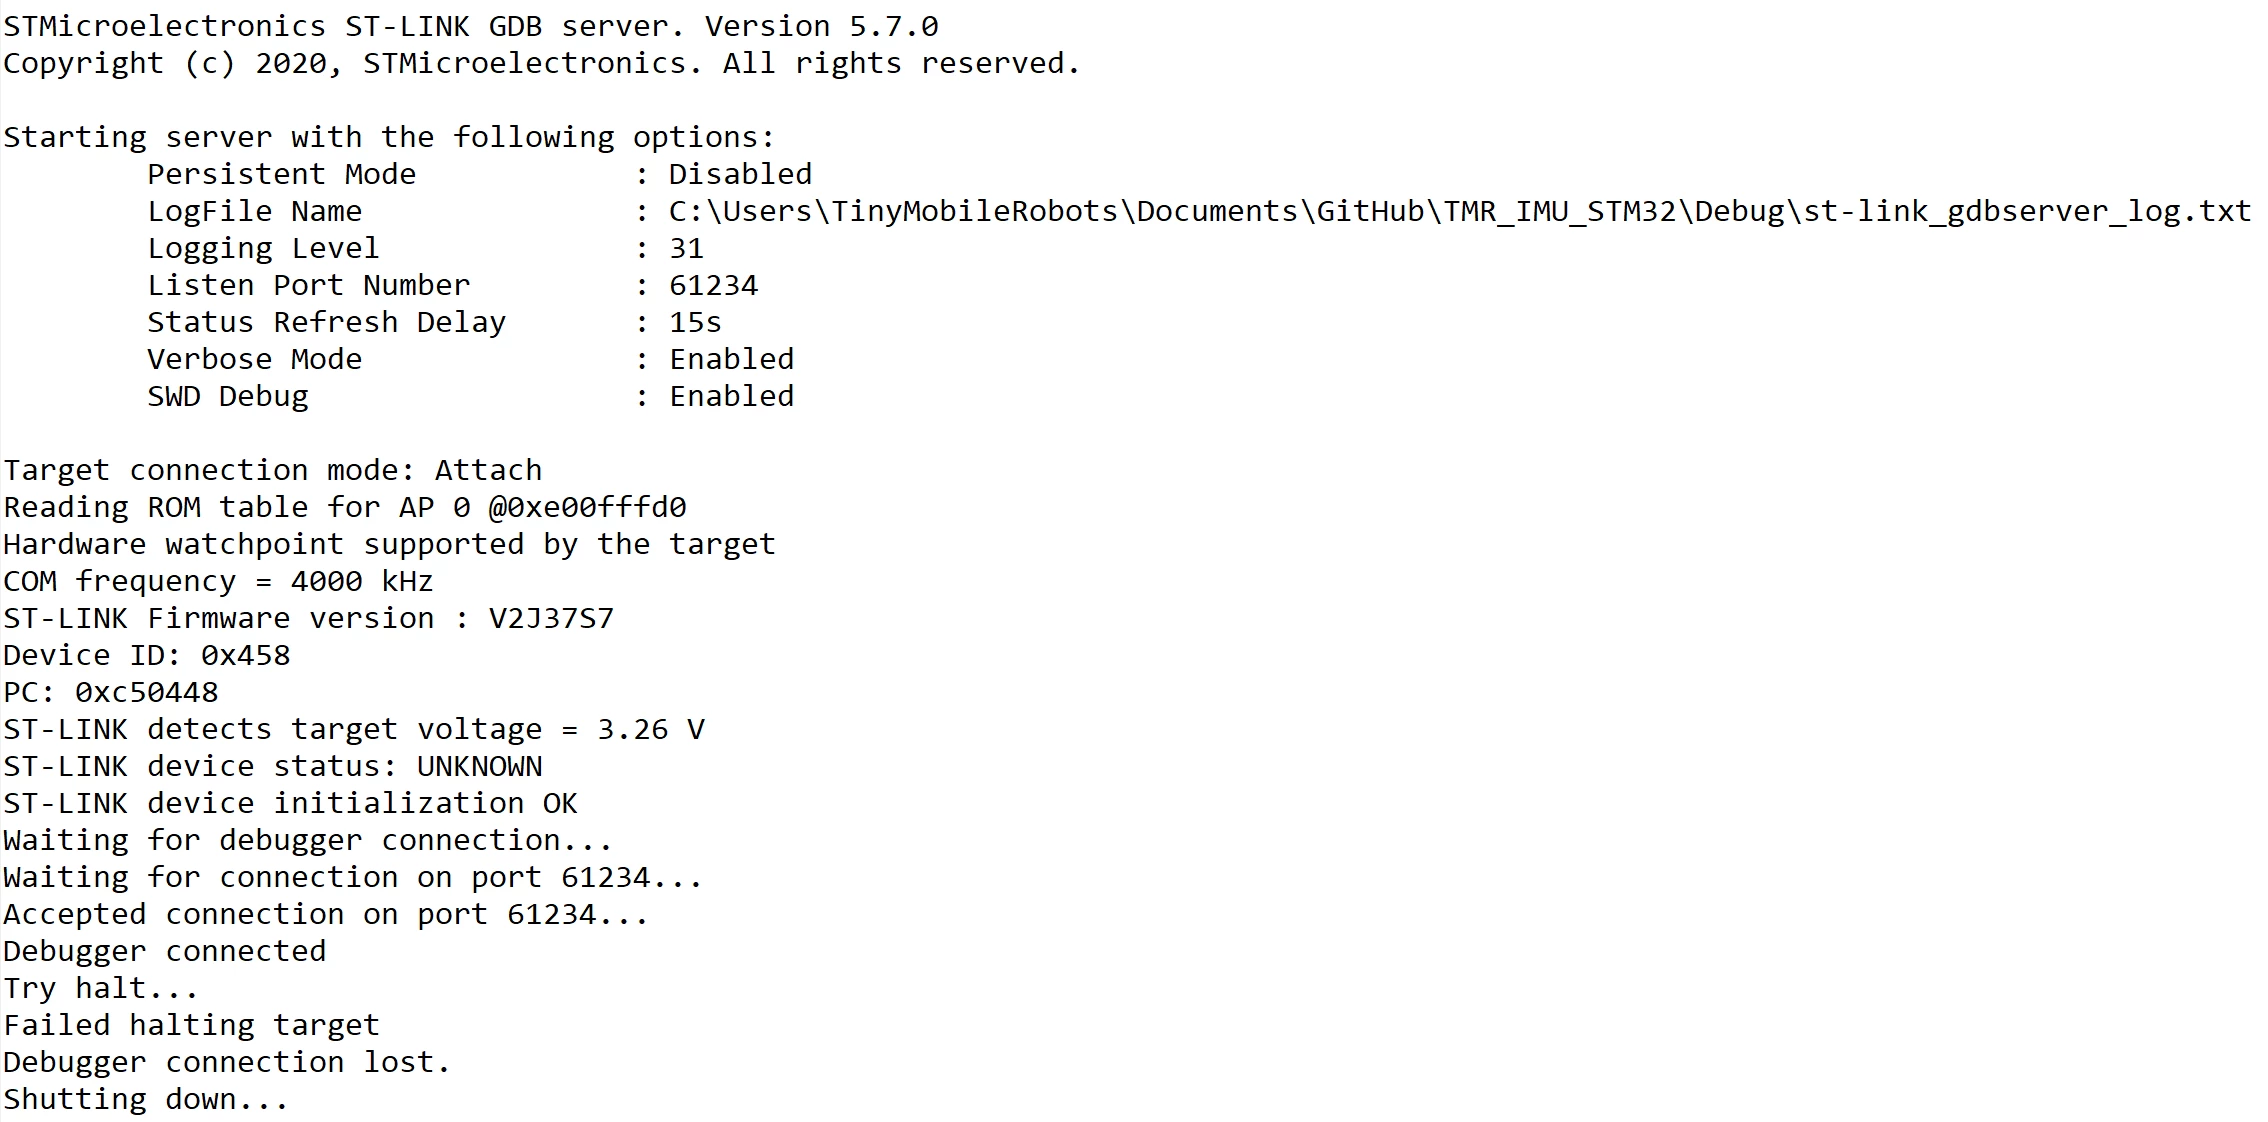
I have chosen the CPU that I have on my custom board (STM32F410R8T6), configured my periphials and written some code. However, I face an issue when trying to debug the program, or run it on the hardware. When I click the debug button, the debug viewer appears shortly, where i can press run and terminate, before it snaps out of it, and shows this error:

The console outputs the following:
0693W000005CljwQAC.png 

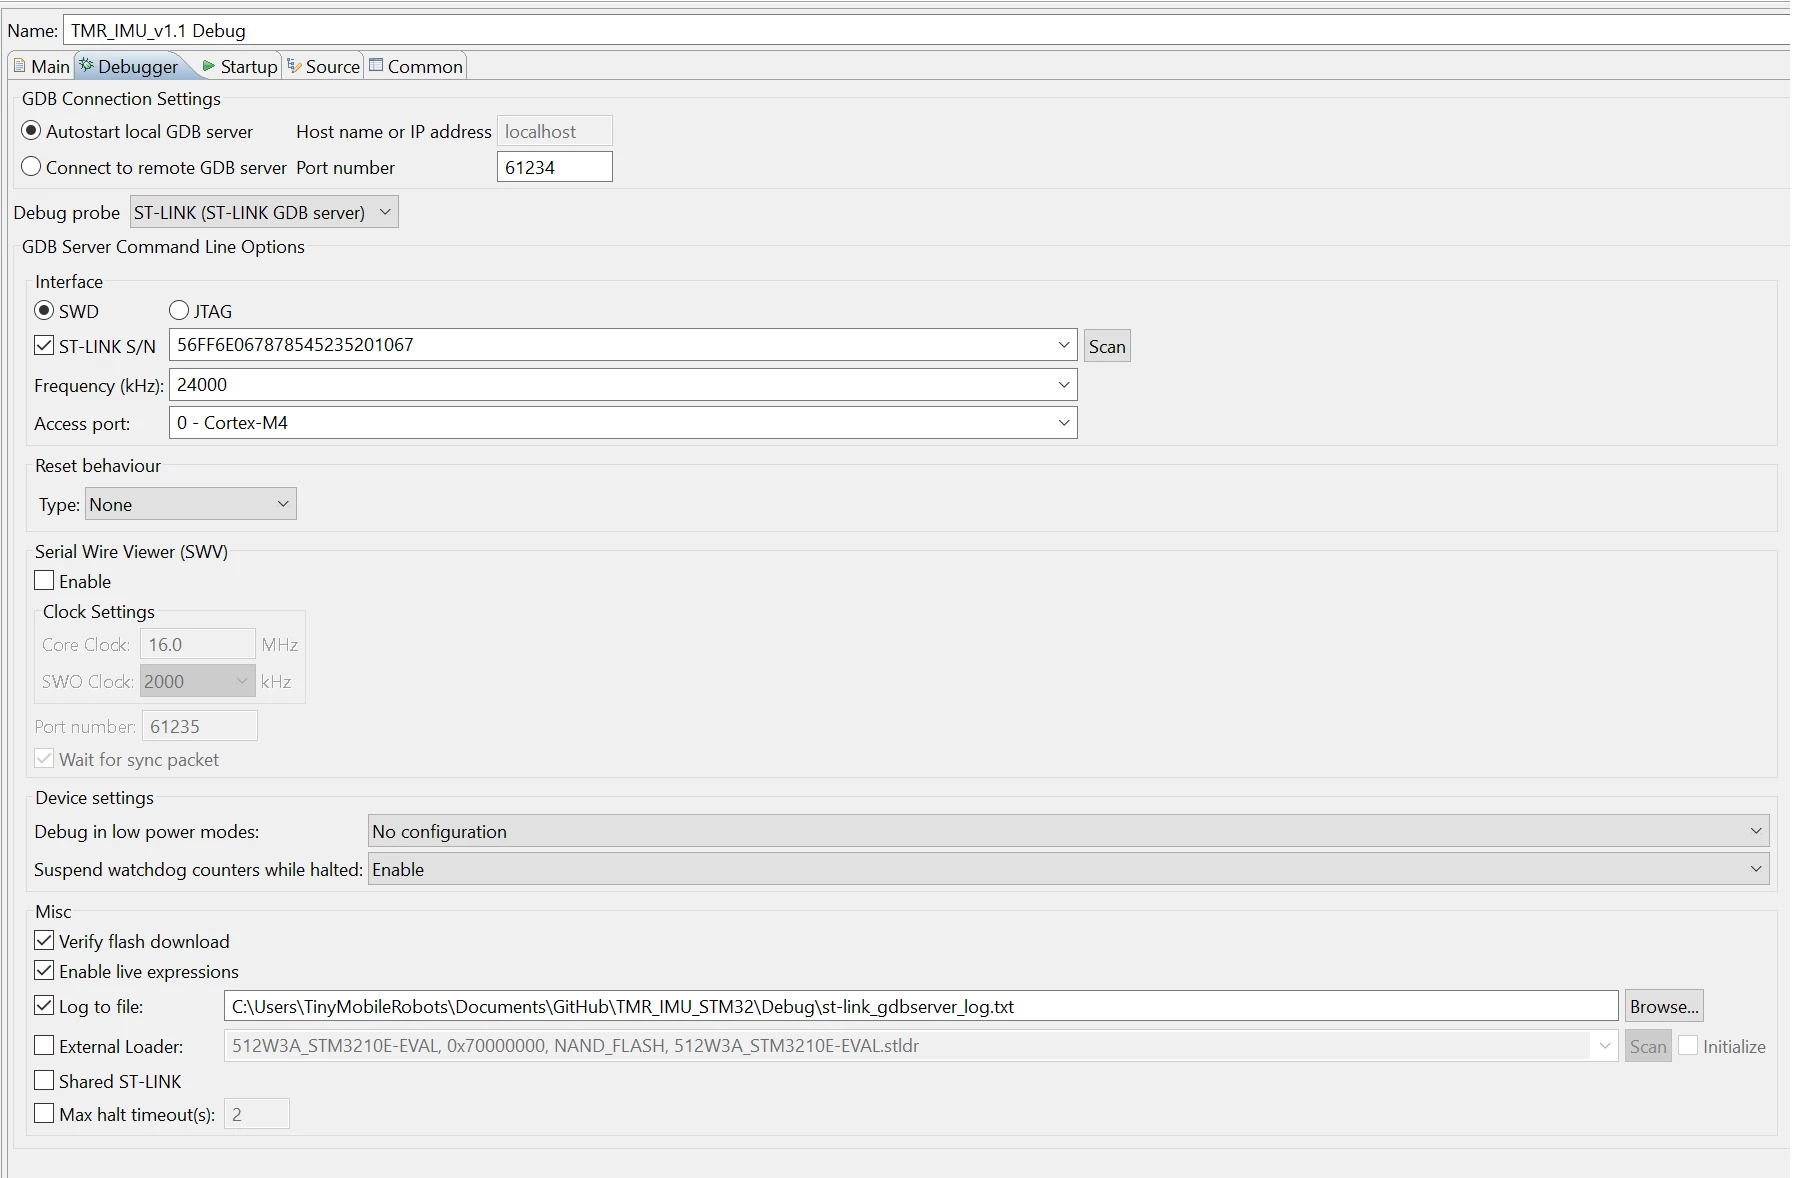
I have messed around with my debug configuration settings. They can be seen here:
0693W000005ClmfQAC.png 

My connections from ST link to MCU are:

St link -> Stm32

Pin 1 (MCU VDD) -> VCC (3.3 V)

Pin 7(SWDIO) -> PA13

Pin 9 (SWCLK) ->PA14

Pin 10 (GND) -> (Common GND)

Pin 15(NRST) -> NRST

Listening on onboard testpoints with oscilloscope shows 3.3 V on pin 1 and 7, and 0 V on Pins 9, 10 and 15. When i press debug i can see the datastream on SWDIO and SWCLK. Nothing appears on NRST.

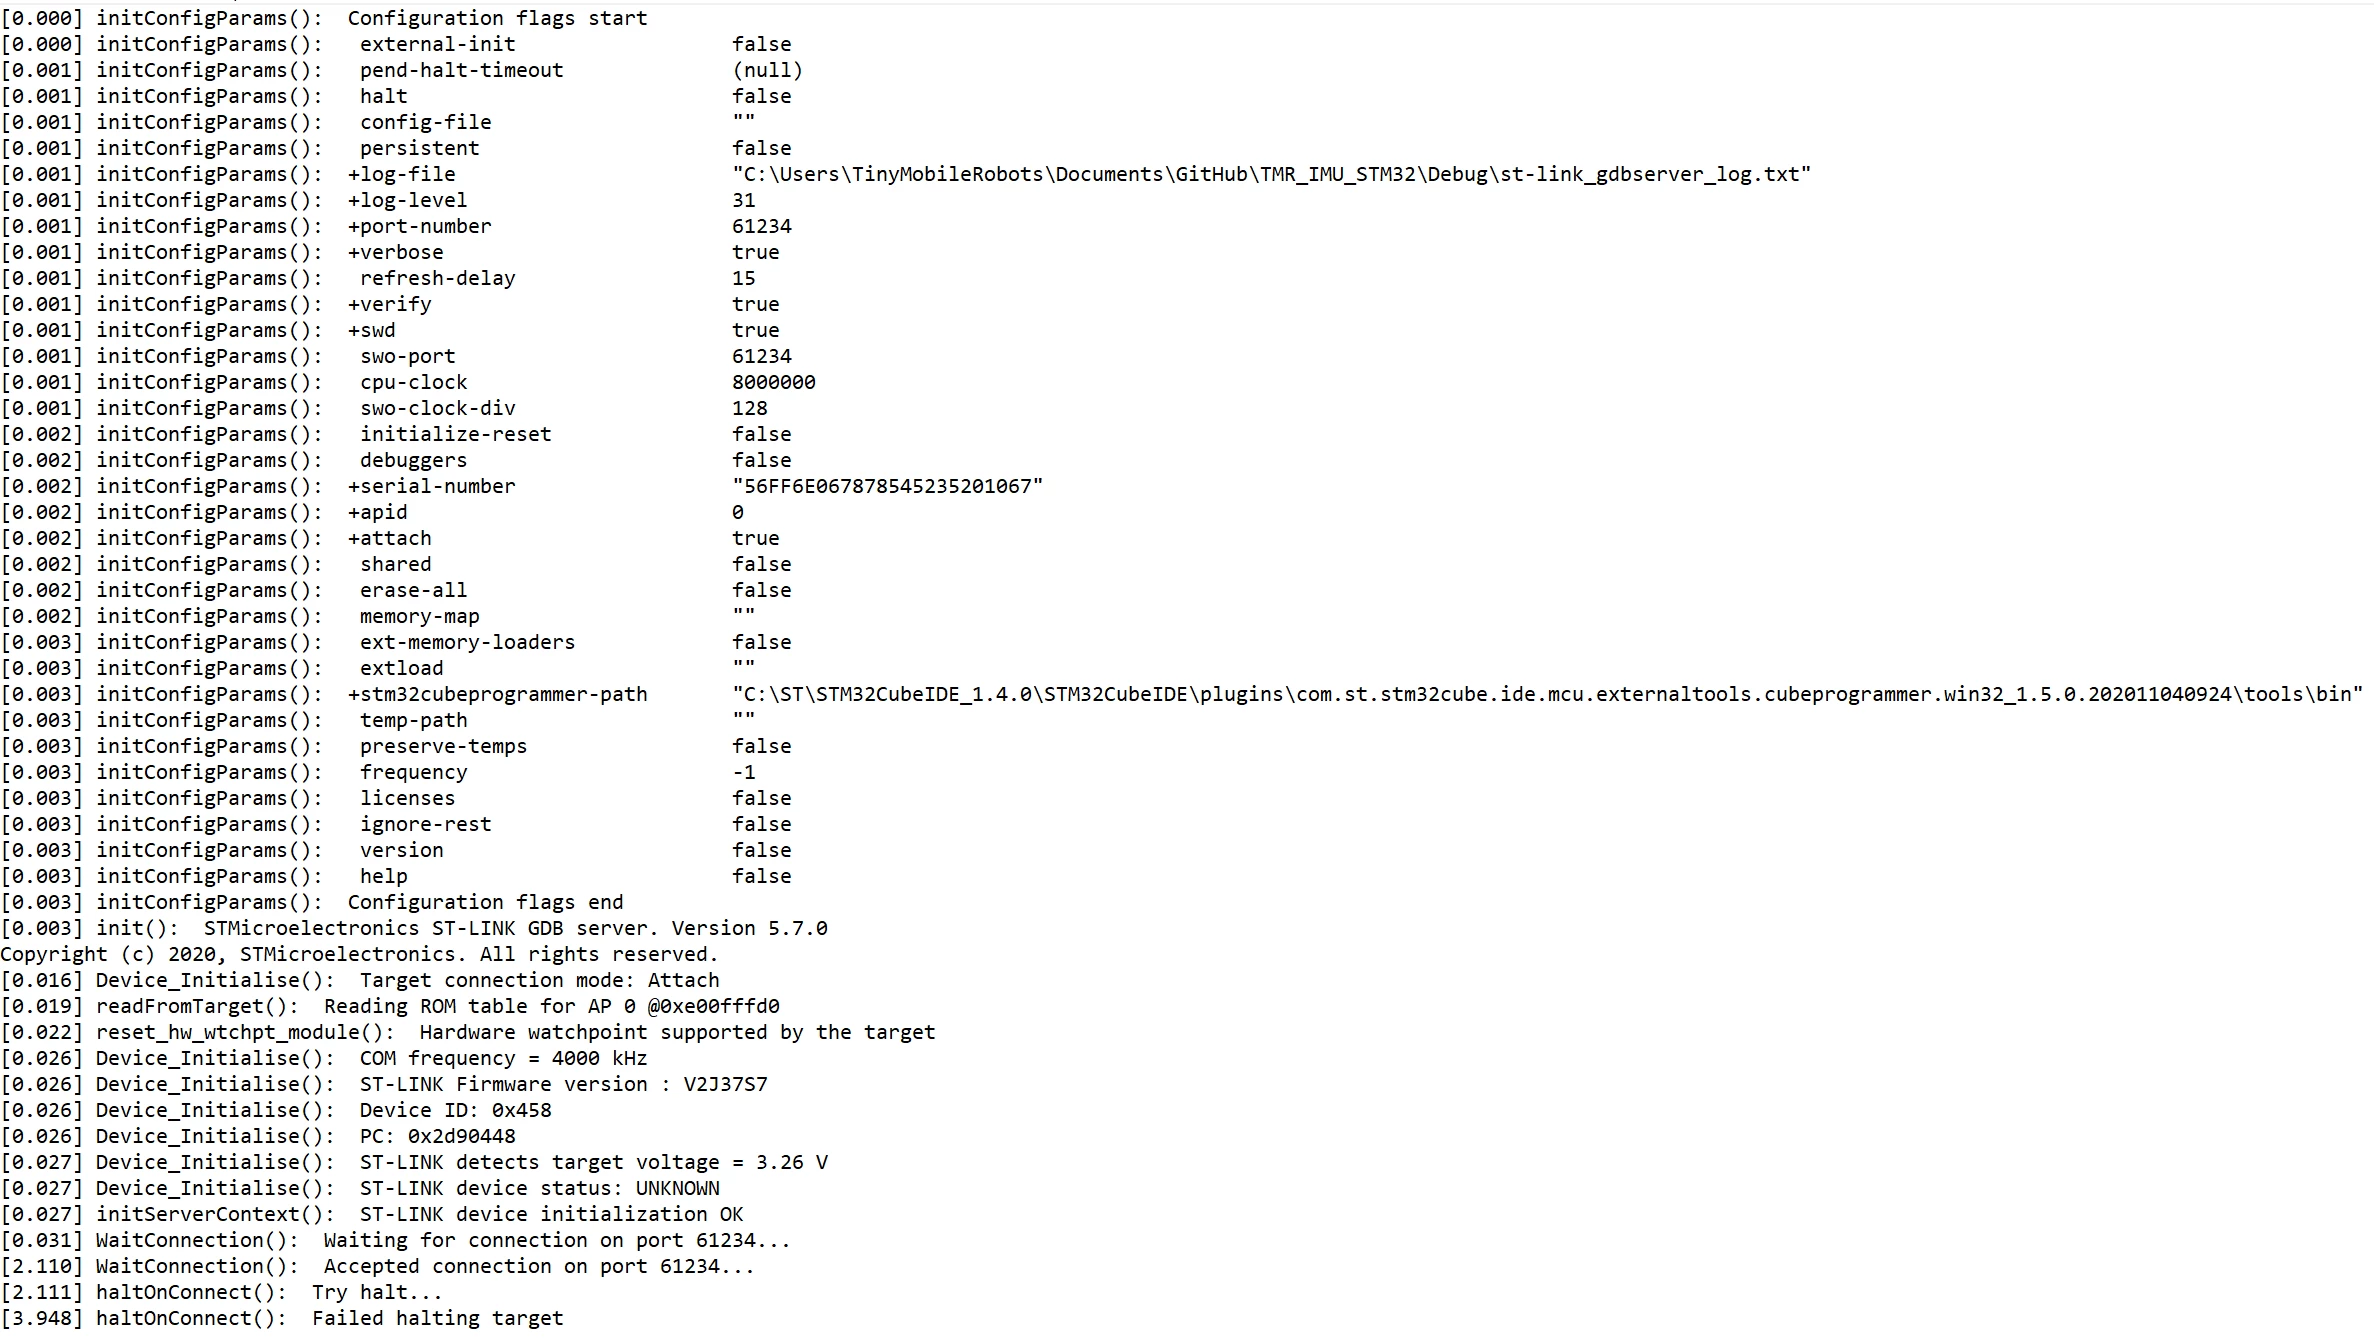
The LED on the ST link shines red when connected to the board. When i press debug it blinks red/green and pauses at green for some time, before going back to red, and the error message pops up. A GDB server logfile is outputted, that can be seen below:

 0693W000005Cln4QAC.png 

This topic has been closed for replies.
Best answer by KnarfB

Q1 gate is floating, hmm...

19 replies

VSøby.1
VSøby.1Author
Associate II
November 26, 2020

tr

KnarfB
Super User
November 26, 2020

There is no text/image after the ":" visible...

VSøby.1
VSøby.1Author
Associate II
November 26, 2020

Yep, my apologies. I have inserted them properly now.

Tesla DeLorean
Guru
November 26, 2020

Do other, less cumbersome, tools connect?​ ie like STM32 Cube Programmer

D​o you have code reconfiguring GPIOA, PA13 or PA14, or have the core entering low power modes or WFI loops?

Tips, Buy me a coffee, or three.. PayPal Venmo (See Profile) Up vote any posts that you find helpful, it shows what's working..
VSøby.1
VSøby.1Author
Associate II
November 26, 2020

0693W000005Cm11QAC.png 

Pin are setup as shown above. At no point in the code do i use PA13 or 14, except for the autogenerated stuff, which i presume sets up the SWD interface. I don't make it enter low power mode, and haven't heard of WFI loops. I have it enter multiple interrupt rutines triggered by both spi and external pins though, but i don't think that should matter. I'll try STM32 Cube Programmer at once!

KnarfB
Super User
November 26, 2020

You can try switching to the other debugger (OpenOCD) in dropdown list.

> Nothing appears on NRST.

Thats because you set Reset behaviour = none. You might change that and check NRST.

VSøby.1
VSøby.1Author
Associate II
November 26, 2020

I tried changing reset behavior to connect under reset. I still see no information (0 V) on the nrst testpoint, but I receive a different error now: 0693W000005CmB1QAK.pngAnd console now reads:

0693W000005CmBGQA0.png

LaurentL
ST Employee
November 26, 2020

KnarfB is right, you must try with "connect under reset" mode to have no issue with appli running and possibly changing SWD pins...

We see the PC value which has a weird value.

Rgds,

Laurent

To give better visibility on the answered topics, please click on Accept as Solution on the reply which solved your issue or answered your question.
VSøby.1
VSøby.1Author
Associate II
November 26, 2020

Check my response to KnarfB regarding this :)

EJOHA
Associate
November 26, 2020

You can also try to connect to the board using STM32CubeProgrammer and see if this works.

If it works you can try to erase the flash with CubeProgrammer.

When using ST-LINK gdbserver it is also possible that you need to reduce the ST-LINK clock frequency if there is a problem using to high frequency due to hw.

VSøby.1
VSøby.1Author
Associate II
November 26, 2020

I have tested the connecting with STM32CubeProgrammer, please see my response to clive1. I have tried lowering the clock frequency aswell. It still gives the same error :(

LaurentL
ST Employee
November 26, 2020

It seems your reset pin is stuck to 0. Did you connect it to something else ? If not, check the wiring and if there is no solder issue on RST pin.

You can also try to use "software system reset", the reset will be done by software instead of nrst pin.

To give better visibility on the answered topics, please click on Accept as Solution on the reply which solved your issue or answered your question.
VSøby.1
VSøby.1Author
Associate II
November 26, 2020

I have something else connected yes. Here is the schematic:

0693W000005CmQkQAK.pngnRST is the reset pin on the STM32. Debugger Reset is the one from the ST-link and Master_Reset is connected to a pinheader, that is currently not connected. The idea is that the STM32 can be reset by the ST-link when debugging, and by another MCU when it is running in the field. I don't think this should cause problems, as the Master_reset is not connected in my current setup. The soldering looks fine.

KnarfB
KnarfBBest answer
Super User
November 26, 2020

Q1 gate is floating, hmm...

VSøby.1
VSøby.1Author
Associate II
November 26, 2020

Grounded it and now i'm all good. Thanks alot!

LaurentL
ST Employee
November 26, 2020

Maybe the Q1 transistor needs to have the Master_Reset pin not floating but at GND (via a pull-down resistor maybe).

To give better visibility on the answered topics, please click on Accept as Solution on the reply which solved your issue or answered your question.
VSøby.1
VSøby.1Author
Associate II
November 26, 2020

Yess! I just came to that realization aswell! I grounded it, and now I connect. Thanks alot you guys!