

[Bug] ITM active port TER defaults to port 0 ENABLED when tracing is DISABLED
Context:
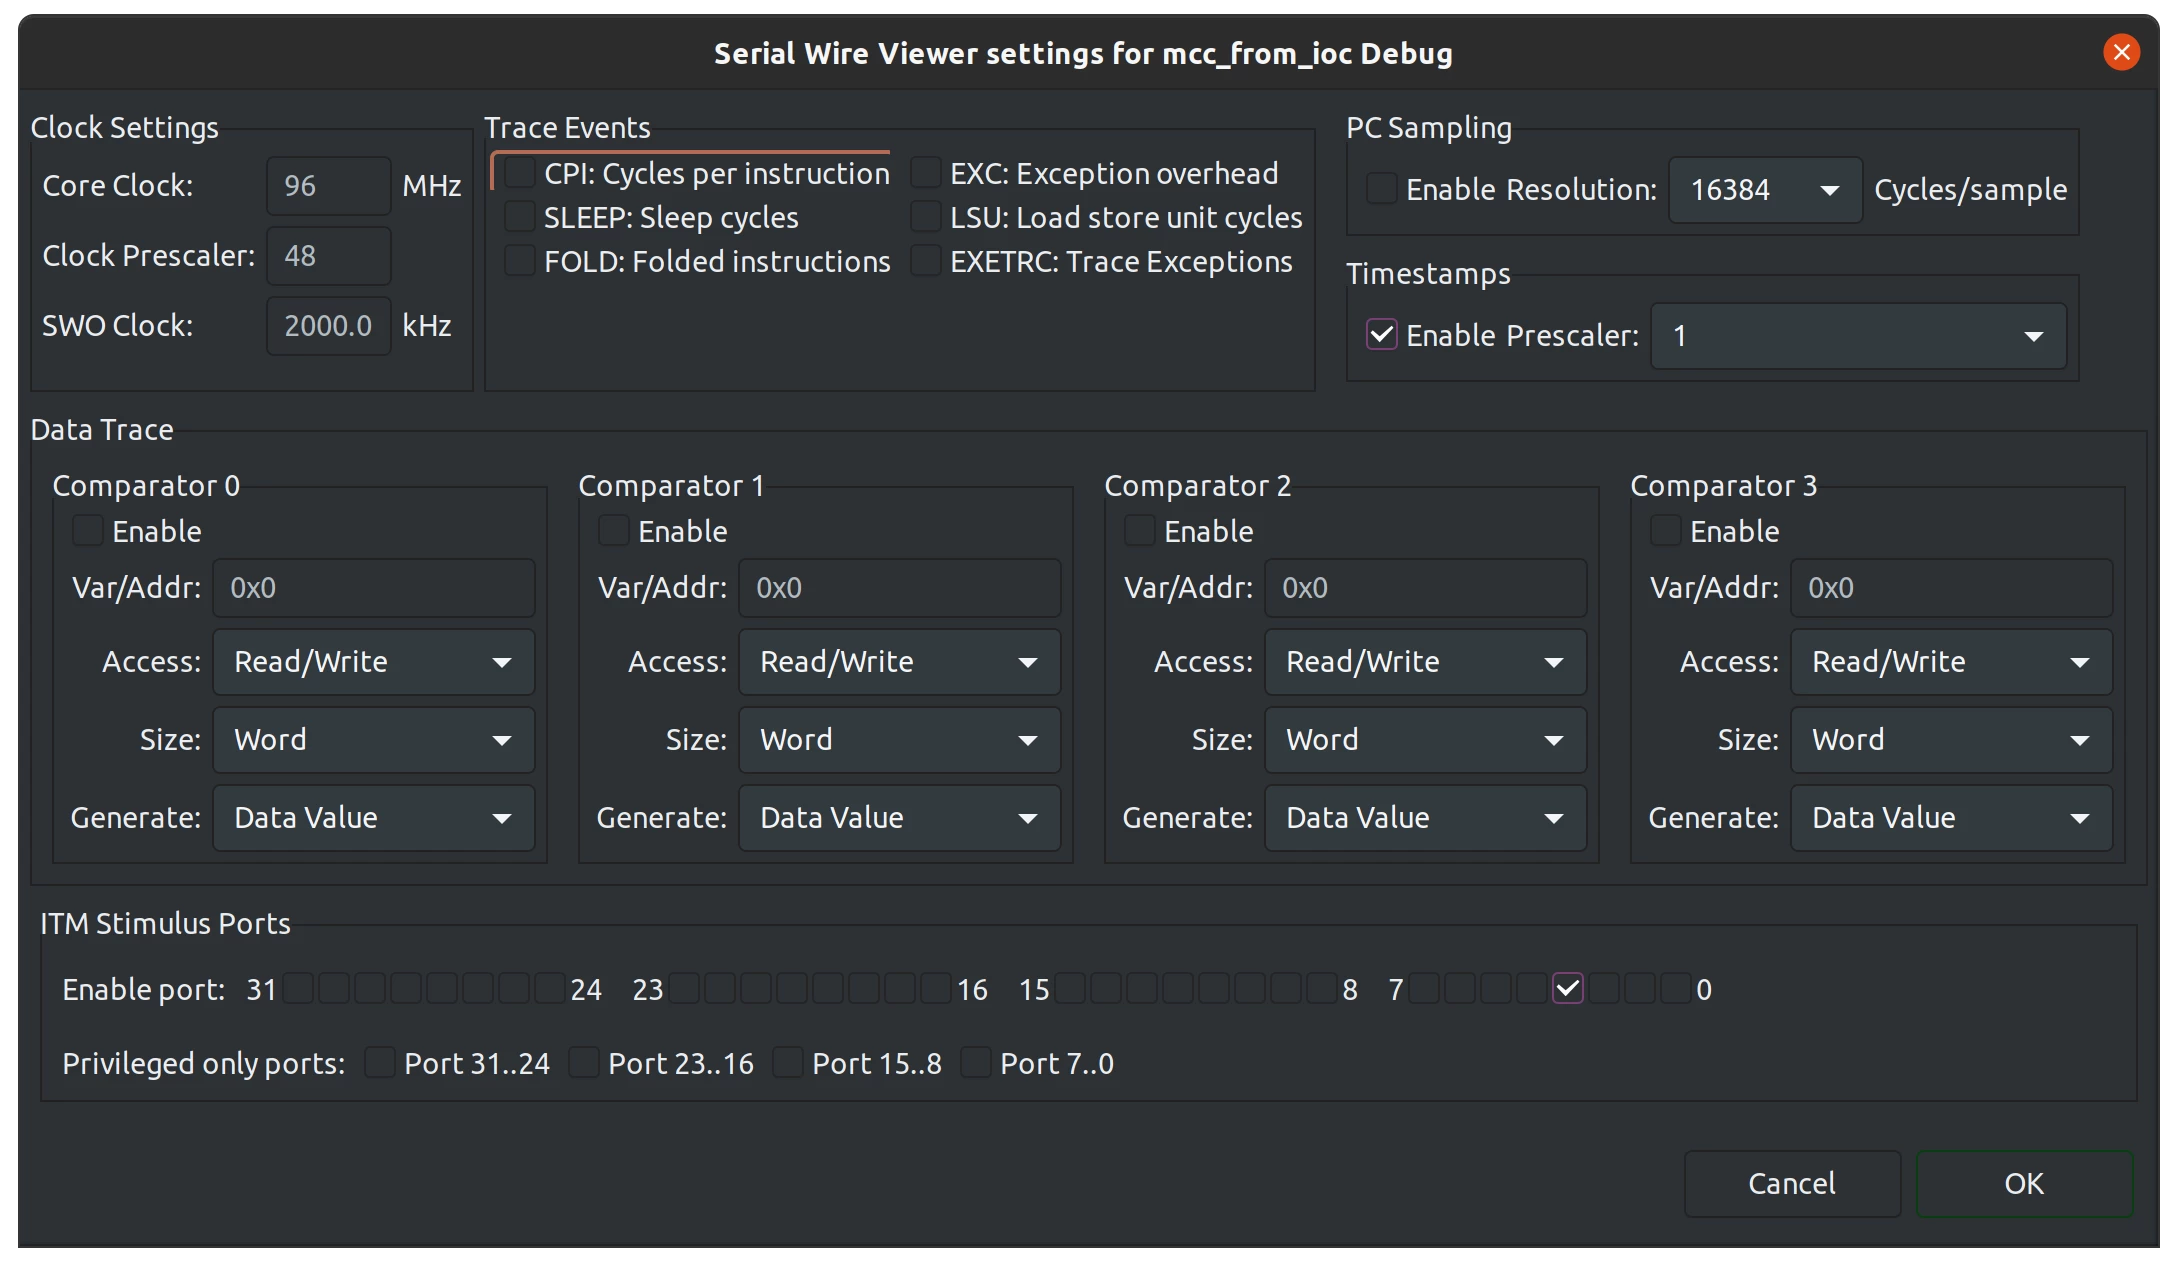
Here's an example ITM configuration with port 3 enabled:
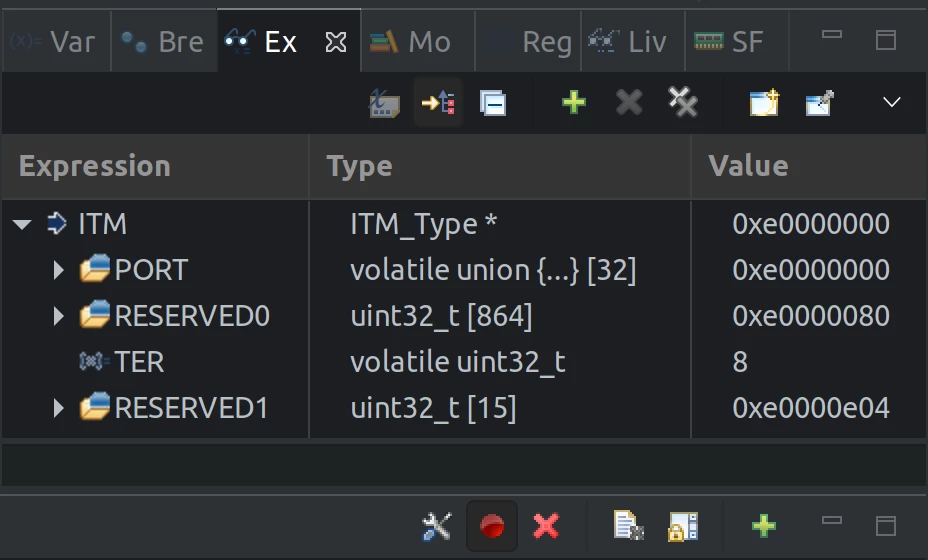
When tracing is enabled in the STM32CubeIDE "SWV ITM Data Console" (click on red circle to "Start Trace"), the bits in the ITM->TER register are set as expected. In this case, value 8 indicates that port 3 is enabled:
Bug:
But when tracing is disabled, the bits in the ITM->TER register are set to an unexpected (and annoying) default value of 1. This indicates that port 0 is enabled, which is definitely undesired.
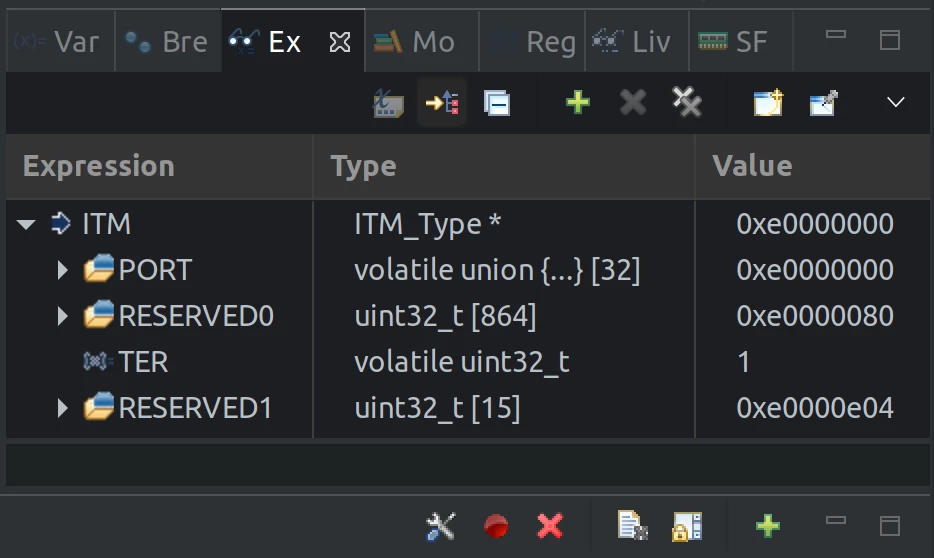
This is problematic for common ITM logging code, which checks if the port is enabled before writing to it.
void itmSendBuf(const char *buf, size_t len)
{
 // Check that ITM is enabled and port 0 is enabled
 if ((ITM->TCR & ITM_TCR_ITMENA_Msk) && (ITM->TER & (1 << 0)))
 {
 for (uint i = 0; i < len; i++)
 {
 ITM_SendChar(buf[i]);
 }
 }
}
The printing loop is always executed, even when the user disables tracing.
A workaround is to configure an additional dummy port (port 2 in this case) to act as a flag for controlling whether to enter the printing loop. That way, when tracing is disabled, at least the dummy port is cleared, so the code can avoid the loop.
 // Check that ITM is enabled and ports 0 and 2 (dummy port) are enabled
 if ((ITM->TCR & ITM_TCR_ITMENA_Msk) && (ITM->TER & (1 << 0)) && (ITM->TER & (1 << 2)))
Another bit of annoying behavior is that there's a mismatch between the state of the "Start Trace" button and the TER values on startup. In this startup state, we get all the negatives of slower code, but without the benefit of seeing the ITM logs.
Startup state:
* Button: Disabled
* TEM: Enabled
Clicking the button one or more times puts things back in sync.
Toggle button once:
* Button: Enabled
* TEM: Enabled
Toggle button twice:
* Button: Disabled
* TEM: Disabled
I think the ideal behavior would be for the IDE to remember whether the user wants tracing and then apply this state to the next debug session. This would also address a similar request in this other thread:
""" - It seems that it is mandatory to click on "Start Trace" on "SWV ITM Data Trace" each time I want to use the console display. So I have to do it every time I run a new debug session. There is a easy way to enable by default the "Start Trace " at each debug session? """
Version info:
STM32CubeIDE version: 1.4.2
Chip: STM32F413
Note that differences in appearance of the above screenshots are just due to an eclipse reskin.
