Hi @Snara.2 ,
you can find an explanation in this presentation, p.133, for the Humidity sensor.
In particular, the csv datalog formatted in excel should look like the following:
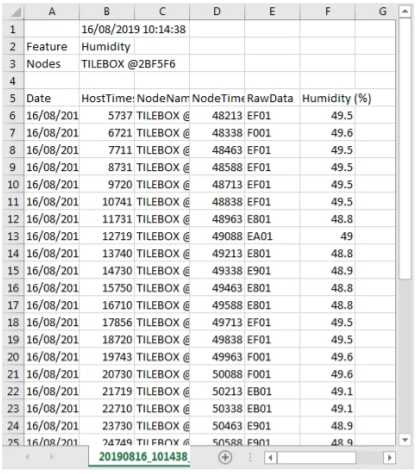 The fist column is the date, and you should format it as a date in excel; then the host time in millisecond (this value can be used as time axis in an x-y graph), is the time from which the device is operating; then the node name and the node time stamp; and finally you have the relevant data, i.e. the humidity raw data in decimal (7502 dec = 1D4E hex) and the physical percentage value 62.9%.
The last value is calculated according to these technical note indications.
If my reply answered your question, please click on Select as Best at the bottom of this post. This will help other users with the same issue to find the answer faster.
-Eleon