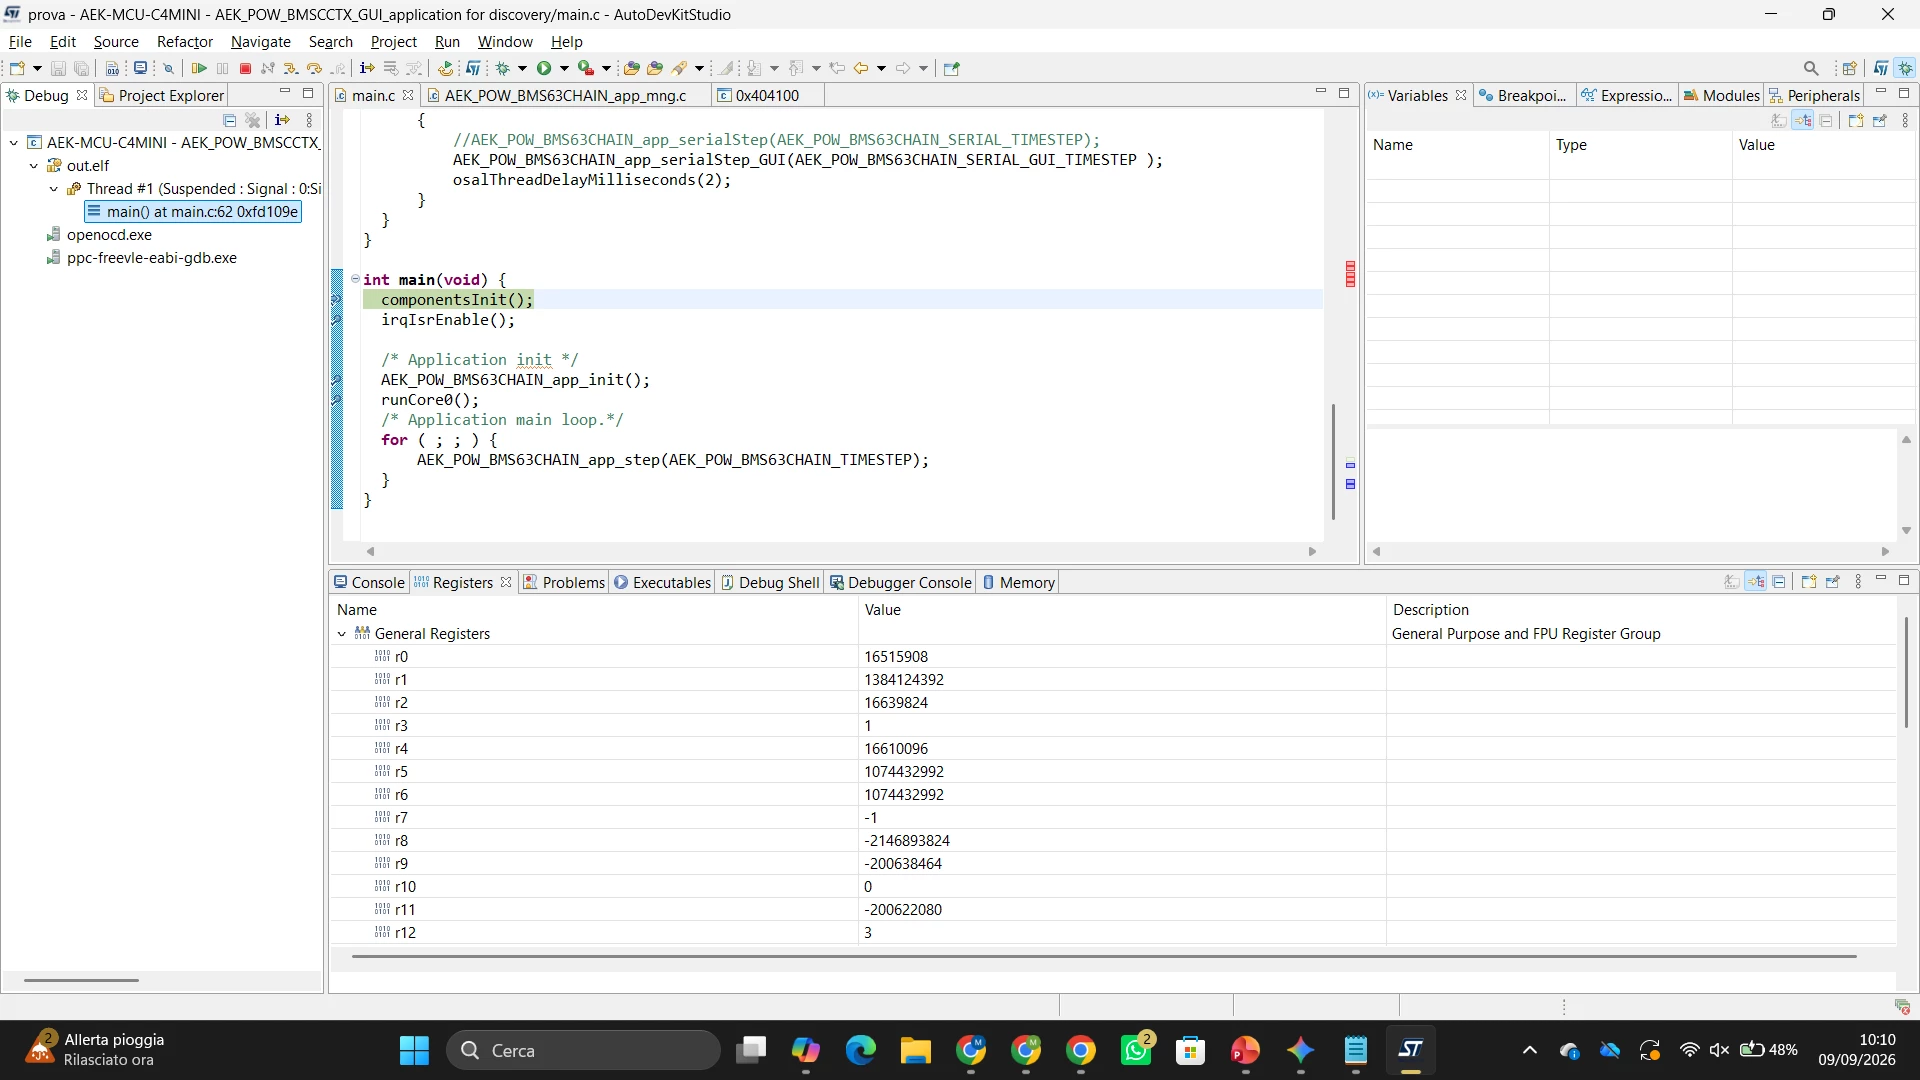
Debugging hangs at 0x404100 on AEK-MCU-C4MINI1 using SPC5LNK
Hello everyone,
I am experiencing a persistent debugging issue using AutoDevKit Studio. The debugger connects successfully to the target, but the application never reaches the main() function, immediately hanging at an exception handler.
Here are the details of my setup and the issue:
1. Part Number
-
Target Board: AEK-MCU-C4MINI1
-
Debugger: AEK-MCU-SPC5LNK
2. Environment
-
IDE: AutoDevKit Studio (Eclipse-based) on Windows 11.
-
Toolchain/Debugger: GDB OpenOCD Debugging (OpenOCD 0.12.0+dev).
3. Schematics Standard ST evaluation board (no custom schematics).
4. Details
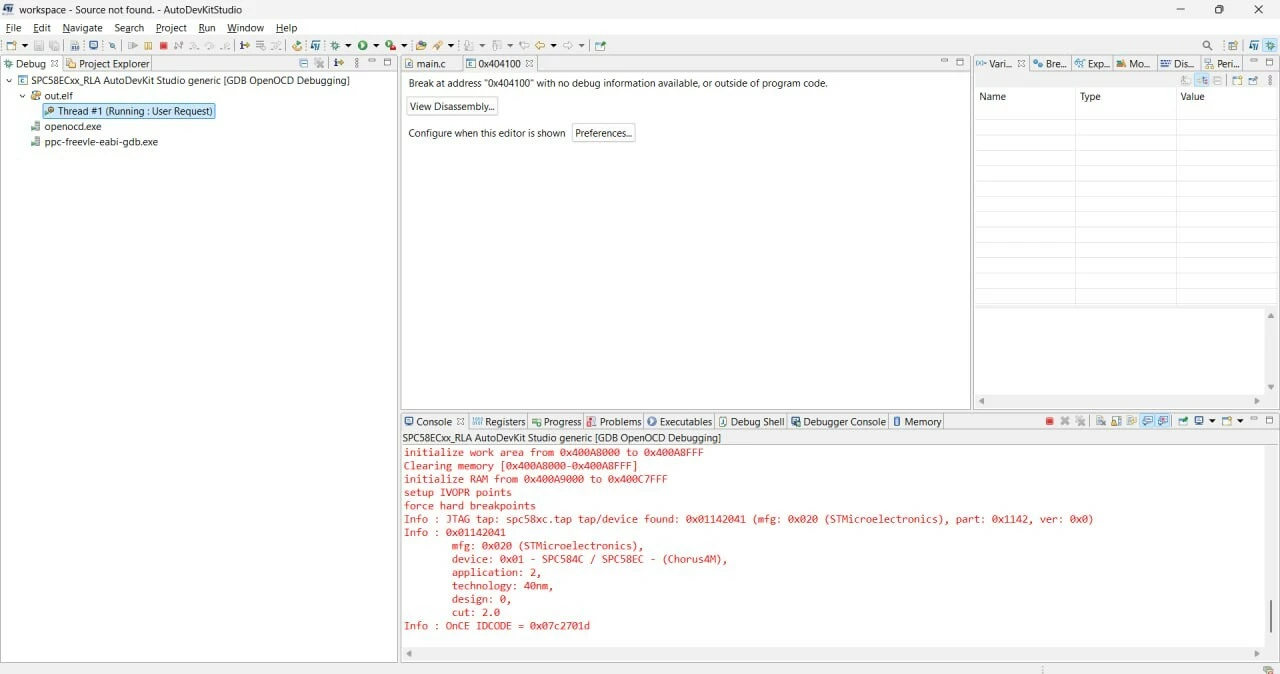
When I launch a debug session, OpenOCD connects successfully, halts the target, and identifies the chip. However, the execution is stuck with the following error: Break at address “0x404100 with no debug information available, or outside of program code.
I am fully aware that the "Source not found" window shown by the IDE is simply a consequence of the core hanging at this specific exception handler address (which naturally lacks source code), rather than a misconfigured source path.
The main anomaly I noticed is a Flash Loading Failure accompanied by GDB packet warnings. In the OpenOCD console, right after reading the flash banks, I get the following warnings: Warn : negative reply, retrying Warn : acknowledgment received, but no packet pending Consequently, the Debugger Console (GDB) only shows the initial GNU GDB welcome message. It appears that due to this communication protocol drop, AutoDevKit is not actually sending/loading the .elf file into the flash memory, despite the debugger connecting properly.
Open On-Chip Debugger 0.12.0+dev-00318-g0e98d766e (2023-05-17-15:52)
Licensed under GNU GPL v2
For bug reports, read
  http://openocd.org/doc/doxygen/bugs.html
adapter srst pulse_width: 100
Started by GNU MCU Eclipse
Info : Listening on port 6666 for tcl connections
Info : Listening on port 4444 for telnet connections
Info : clock speed 4000 kHz
Info : JTAG tap: spc58xc.tap tap/device found: 0x01142041 (mfg: 0x020 (STMicroelectronics), part: 0x1142, ver: 0x0)
Info : 0x01142041
  mfg: 0x020 (STMicroelectronics),
  device: 0x01 - SPC584C / SPC58EC - (Chorus4M),
  application: 2,
  technology: 40nm,
  design: 0,
  cut: 2.0
Info : starting gdb server for spc58xc.cpu on 3333
Info : Listening on port 3333 for gdb connections
Info : OnCE IDCODE = 0x07c2701d
target halted
Info : Target status: halted - PC: 0xf7fb8004
Info : accepting 'gdb' connection on tcp/3333
Info : JTAG tap: spc58xc.tap tap/device found: 0x01142041 (mfg: 0x020 (STMicroelectronics), part: 0x1142, ver: 0x0)
Info : 0x01142041
  mfg: 0x020 (STMicroelectronics),
  device: 0x01 - SPC584C / SPC58EC - (Chorus4M),
  application: 2,
  technology: 40nm,
  design: 0,
  cut: 2.0
Info : OnCE IDCODE = 0x07c2701d
Disable Software Watchdog Timer
Cache invalidate
Init regs
initialize work area from 0x400A8000 to 0x400A8FFF
Clearing memory [0x400A8000-0x400A8FFF]
initialize RAM from 0x400A9000 to 0x400C7FFF
setup IVOPR points
Disable Software Watchdog Timer
Cache invalidate
Init regs
initialize work area from 0x400A8000 to 0x400A8FFF
Clearing memory [0x400A8000-0x400A8FFF]
initialize RAM from 0x400A9000 to 0x400C7FFF
setup IVOPR points
Info : flash: 4096 kbytes @ 0x00fc0000
Info : flash: 144 kbytes @ 0x0060c000
Info : flash: 32 kbytes @ 0x00680000
Info : flash: 32 kbytes @ 0x00800000
Warn : negative reply, retrying
Warn : acknowledgment received, but no packet pending
Warn : Prefer GDB command "target extended-remote :3333" instead of "target remote :3333"
Info : JTAG tap: spc58xc.tap tap/device found: 0x01142041 (mfg: 0x020 (STMicroelectronics), part: 0x1142, ver: 0x0)
Info : 0x01142041
  mfg: 0x020 (STMicroelectronics),
  device: 0x01 - SPC584C / SPC58EC - (Chorus4M),
  application: 2,
  technology: 40nm,
  design: 0,
  cut: 2.0
Info : OnCE IDCODE = 0x07c2701d
Disable Software Watchdog Timer
Cache invalidate
Init regs
initialize work area from 0x400A8000 to 0x400A8FFF
Clearing memory [0x400A8000-0x400A8FFF]
initialize RAM from 0x400A9000 to 0x400C7FFF
setup IVOPR points
force hard breakpoints
Info : JTAG tap: spc58xc.tap tap/device found: 0x01142041 (mfg: 0x020 (STMicroelectronics), part: 0x1142, ver: 0x0)
Info : 0x01142041
  mfg: 0x020 (STMicroelectronics),
  device: 0x01 - SPC584C / SPC58EC - (Chorus4M),
  application: 2,
  technology: 40nm,
  design: 0,
  cut: 2.0
Info : OnCE IDCODE = 0x07c2701d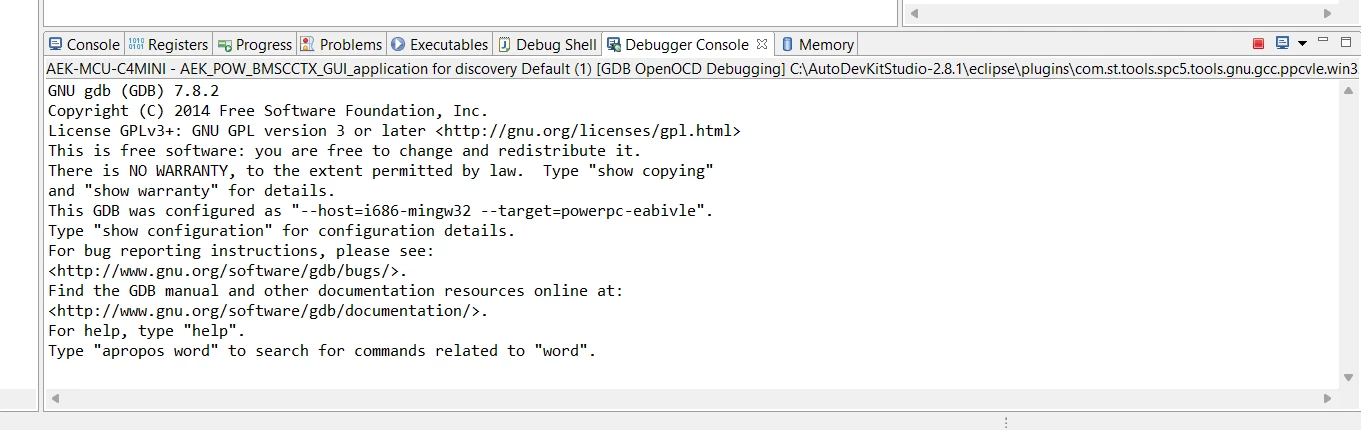
5. Expected behavior
The IDE should load the newly compiled .elf firmware into the microcontroller's flash memory, and the debugger should halt correctly at the main() function, allowing me to step through the code.
6. How to reproduce
-
Connect the AEK-MCU-C4MINI1 to the PC using the AEK-MCU-SPC5LNK debugger.
-
Create or import a standard SPC5 Application Component project in AutoDevKit Studio.
-
Build the project.
-
Launch the GDB OpenOCD Debugging configuration.
-
The debug session starts but hangs immediately at 0x404100.
Debug configuration:
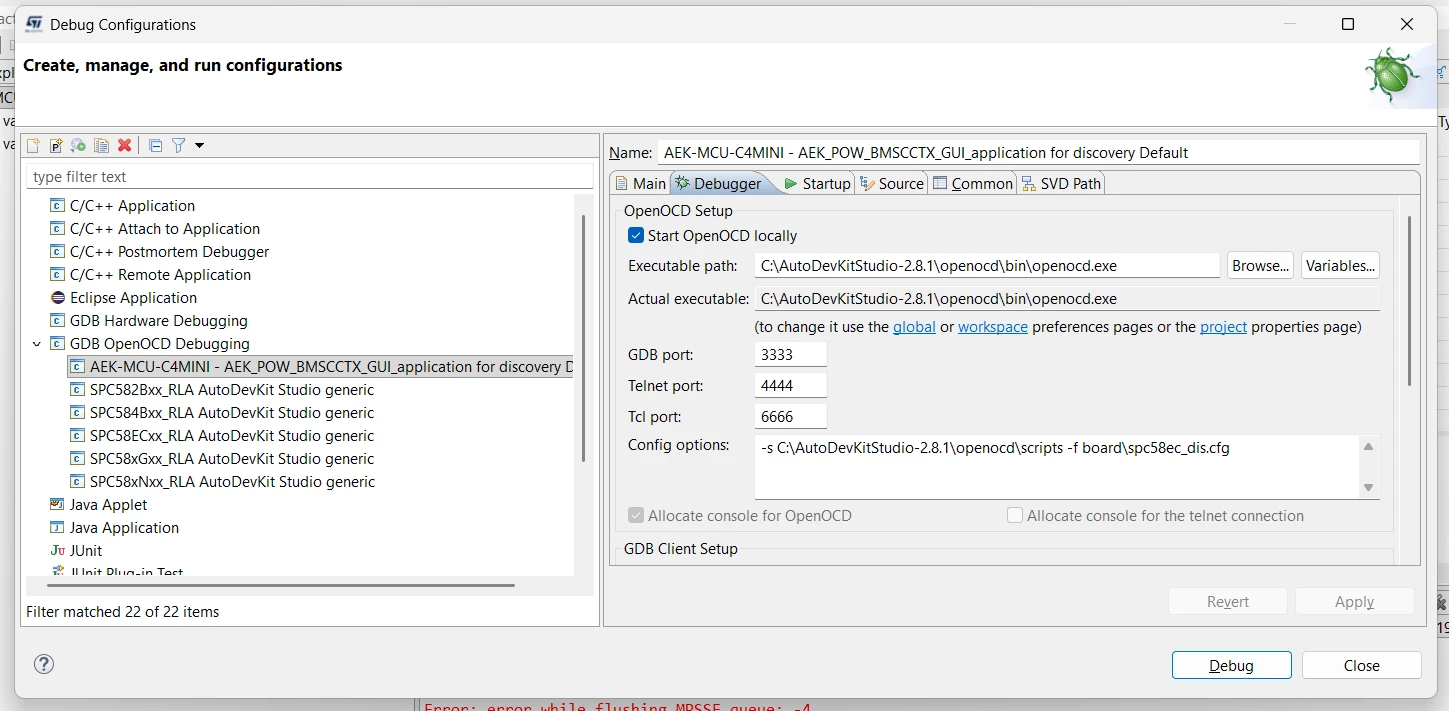
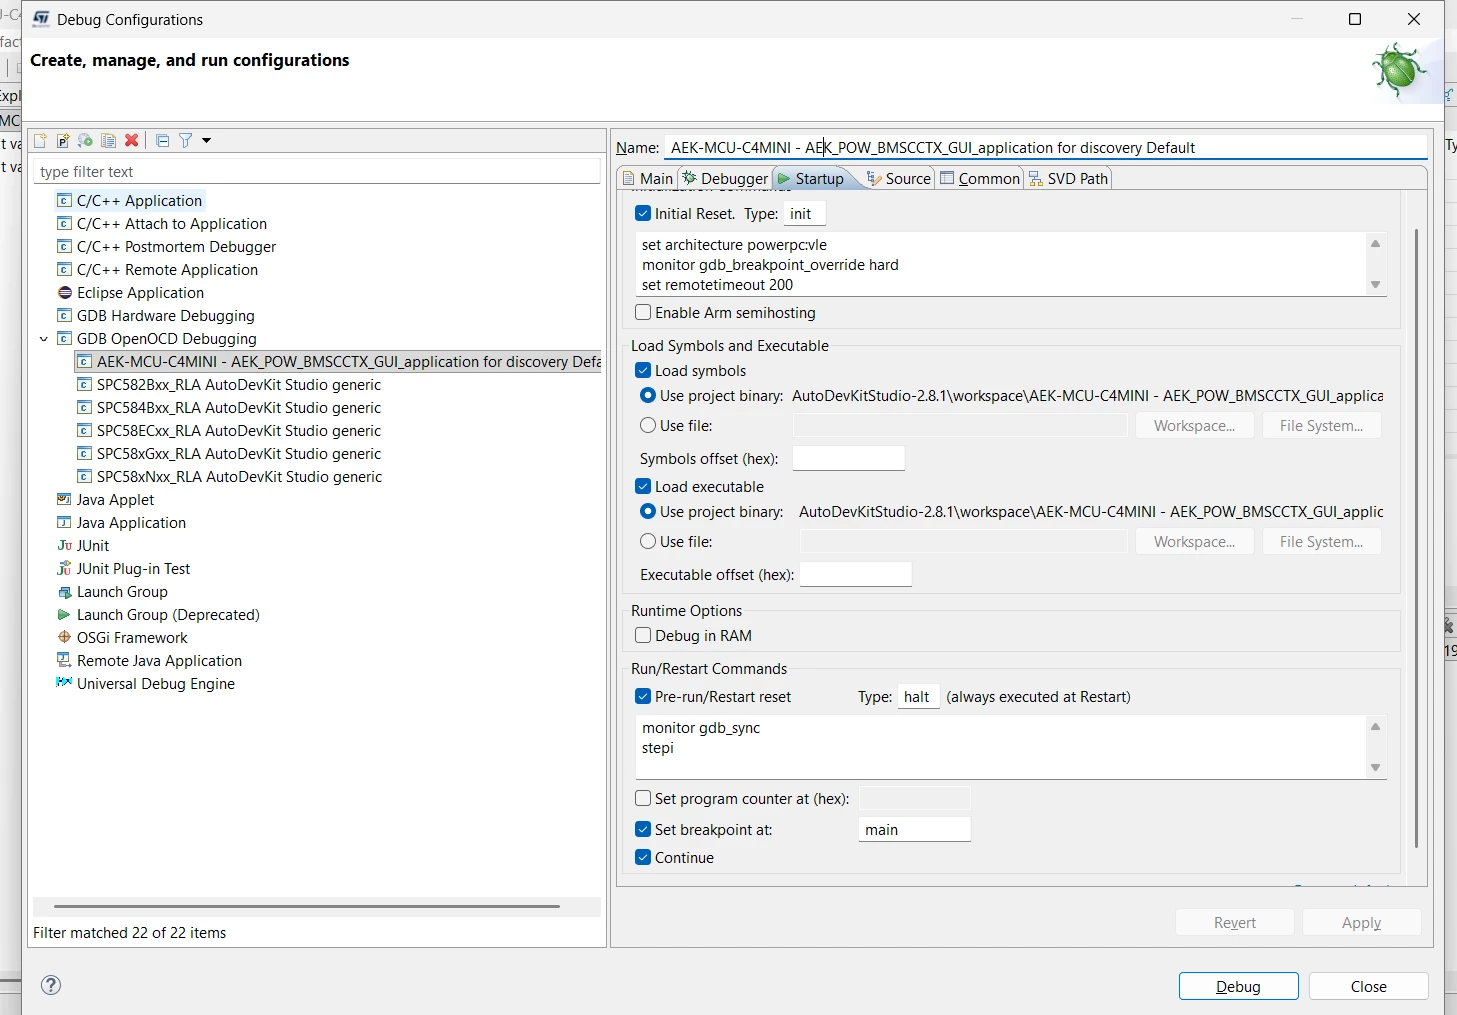
SVD path: C:\AutoDevKitStudio-2.8.1\openocd\svd\spc58\SPC58ECx.svd
7. Occurrence Systematic (happens 100% of the time).
8. Sanity checks
I have already performed the following troubleshooting steps to rule out basic configuration errors:
-
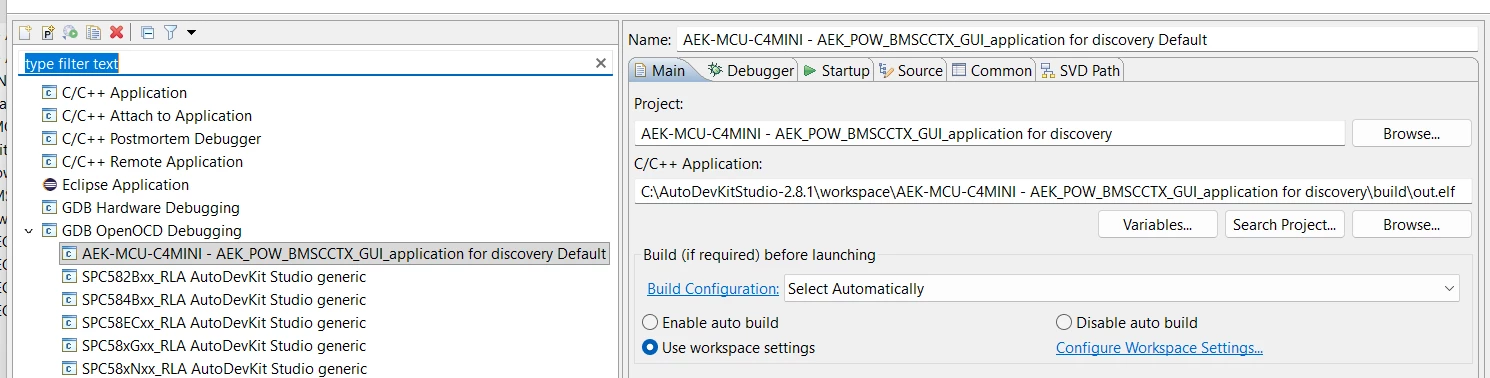
Executable Linked: Confirmed that the correct out.elf file is explicitly selected in the Debug Configuration -> Main tab.
-
Startup Configuration: Confirmed that Load excecutable and Load symbols are checked in the Startup tab.
-
Target Config: Ensured the OpenOCD config points to board\spc58ec_dis.cfg to match the detected IDCODE.
-
Hardware checks: Verified all jumpers on the C4MINI1 (JP4, JP5, JP6, JP7, JP10, JP11, JP12, JP13 are properly closed).
-
Breakpoints: Cleared all manual breakpoints in the IDE.
Could anyone explain why AutoDevKit Studio/GDB is dropping the connection with OpenOCD (negative reply, retrying), failing to load the executable into the board, and hanging at this address?
Thank you in advance for your support.