- STMicroelectronics Community
- STM32 MPUs
- STM32 MPUs products
- How to debug STM32MP1(Cortex-M4) firmware on user ...
- Subscribe to RSS Feed
- Mark Topic as New
- Mark Topic as Read
- Float this Topic for Current User
- Bookmark
- Subscribe
- Mute
- Printer Friendly Page
How to debug STM32MP1(Cortex-M4) firmware on user board?
- Mark as New
- Bookmark
- Subscribe
- Mute
- Subscribe to RSS Feed
- Permalink
- Email to a Friend
- Report Inappropriate Content
2021-03-20 07:17 PM
I have the STM32MP157C-DK2, and I plan to make a user board.
Before creating a user board, I have a question.
1. I want to know how to debug Cortex-M4 firmware on the user board. GDB debug is used in No. 7 in the link below.
In STM32CubeIDE, STM32MP157C-DK2 can debug the firmware through ST-LINK MCU (OpenOCD), but there is no ST-LINK MCU on the user board, so I am curious about how to debug in STM32CubeIDE. Is debugging by connecting Segger J-link or ST-LINK (V2/V3) to the user board? I want to know if it is possible and how to do it if possible.
- Labels:
-
STM32MP15 Lines
- Mark as New
- Bookmark
- Subscribe
- Mute
- Subscribe to RSS Feed
- Permalink
- Email to a Friend
- Report Inappropriate Content
2021-03-23 02:14 AM
Hi @HAPPYDAY ,
If there's no embed ST-Link in your design you can use external STLinkV2/V3 probe since you expose SWD signal on one connector.
Olivier
In order to give better visibility on the answered topics, please click on 'Accept as Solution' on the reply which solved your issue or answered your question.
- Mark as New
- Bookmark
- Subscribe
- Mute
- Subscribe to RSS Feed
- Permalink
- Email to a Friend
- Report Inappropriate Content
2021-03-24 02:14 AM
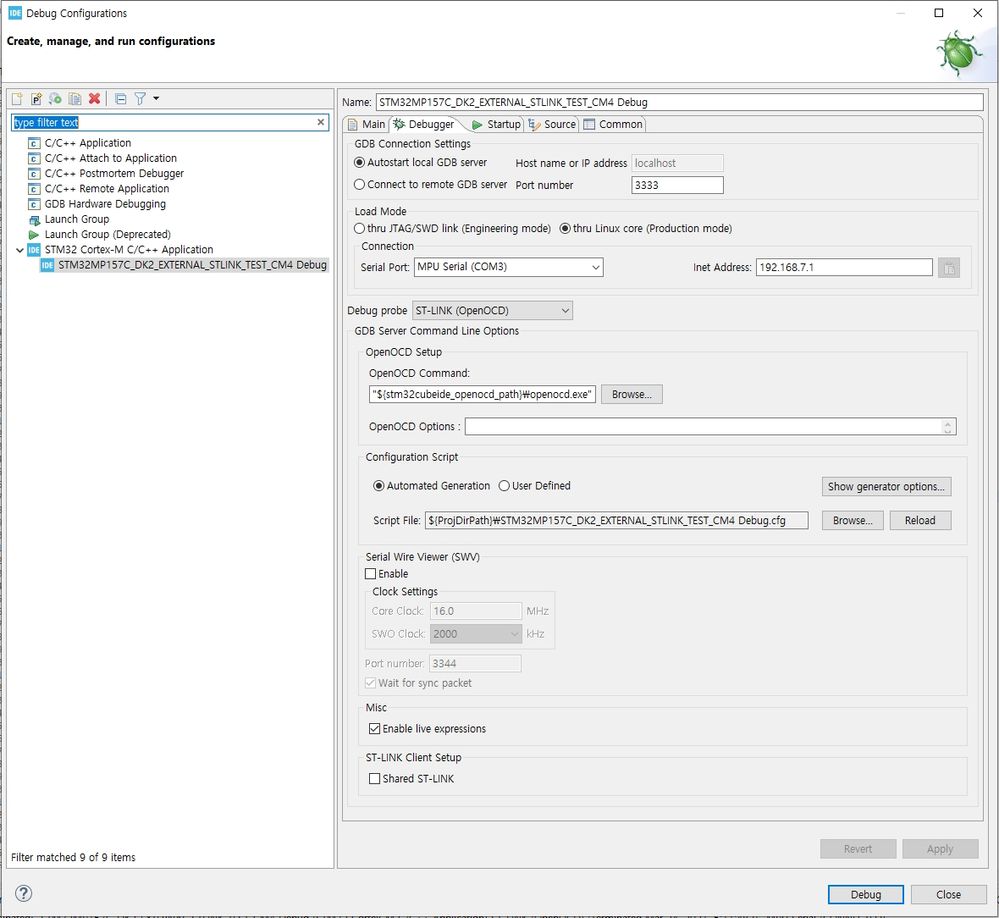
Debugging works by connecting cables to CN7 and CN11 in STM32MP157C-DK2 and setting them as shown in the attached figure.


- Mark as New
- Bookmark
- Subscribe
- Mute
- Subscribe to RSS Feed
- Permalink
- Email to a Friend
- Report Inappropriate Content
2023-10-10 11:04 PM
Hello Olivier,
so, is it possible to use a STLink V2 (i.e. without Virtual COM Ports on connector) and without using the gdbserver on the STLink Embedded Hardware?
I am able to upload the firmware on the CoProcessor M4:
echo "firmwarename" > /sys/class/remoteproc/remoteproc0/firmware
run it using the following command:
echo "start" > /sys/class/remoteproc/remoteproc0/stateand it works, even compiled on debug mode, the trace is working fine:
cat /sys/kernel/debug/remoteproc/remoteproc0/trace0
Now I am trying to figure out how to debug it with a OpenOCD JTAG or STLink V2 debugger without using STM32CubeIDE.
Do I need to start gdbserver on the Linux core? How to find the ProcessID to attach? The PID is not shown as the code is running in a RPMSG based co-processor... Are there useful documentation on that instead of tell me: USE STLINKV3 AND STM32CUBEIDE sentence... 😉
Thank you,
Gianluca
- STM32CubeProgrammerLauncher won't launch on Ubuntu machine in STM32CubeProgrammer (MPUs)
- M4 Coprocessor (of MP15xx) DMA SPI4 example stays in "busy" state after first transmission in STM32 MPUs Embedded software
- USB Serial drivers for Modem LTE (Spreadtrum?) in STM32 MPUs Boards and hardware tools
- STM32MP151C [linux-stm32mp] errors during writing on MMC in STM32 MPUs Embedded software
- OPCUA asynchronous client communication in STM32 MPUs Embedded software