- STMicroelectronics Community
- STM32 MCUs Software development tools
- STM32CubeIDE (MCUs)
- Debug using STM32CubeIde ??
- Subscribe to RSS Feed
- Mark Topic as New
- Mark Topic as Read
- Float this Topic for Current User
- Bookmark
- Subscribe
- Mute
- Printer Friendly Page
Debug using STM32CubeIde ??
- Mark as New
- Bookmark
- Subscribe
- Mute
- Subscribe to RSS Feed
- Permalink
- Email to a Friend
- Report Inappropriate Content
2020-09-17 07:25 AM
Hello,
I am working on a card with an STM32H745 processor.
I have a few questions regarding debugging (with a V3 probe):
1) is it possible to make a hard reset of the chip?
2) is it possible to reset the cores independently?
3) is it possible to do some debugging at assembly level (I didn't understand why I can't step by step in the dissassembly window) ?
4) is it possible to connect the debugger without interrupting the cores?
5) When connecting the debbuger and programming, the program is launched briefly with the version previously loaded. is this normal?
6) is it possible to put the SFR in the "live expressions"?
7) when i debug one core, i also want to see the other core's variables. I can do this by putting their address, but is it possible to do it using their name?
😎 I tried STM32CubeMonitor which seems to connect faster (and with less interference) than the debugger on STM32CubeIde. Is this normal?
Best regards
Jean-Louis
- Labels:
-
DEBUG
-
STM32CubeIDE
-
STM32H7 Series
- Mark as New
- Bookmark
- Subscribe
- Mute
- Subscribe to RSS Feed
- Permalink
- Email to a Friend
- Report Inappropriate Content
2020-09-17 12:38 PM
3)
https://mcuoneclipse.com/2012/10/27/assembly-instruction-stepping/
4)
To debug your program without downloading it:
Go to Debug Configurations... -> Startup -> select load image -> Edit... -> uncheck Download
To debug without resetting the device:
Go to Debug Configurations... -> Debugger -> in Reset Behavior, select "None"
- Mark as New
- Bookmark
- Subscribe
- Mute
- Subscribe to RSS Feed
- Permalink
- Email to a Friend
- Report Inappropriate Content
2020-09-19 10:48 AM
Thanks for the link ... I hadn't seen the button!
This is the first time that I seriously use Eclipse (I know, Keil IAR, Segger ...), it is a bit trying experience to do hard debugging.
The solution you recommend for connecting does not work for me quite properly. When you connect the debugger, the processor is stopped for a few ms, which is annoying when you work with inductive devices.
In addition there are very often (several times a day) connection problems with the debugger, "Error in final launch sequence, Failed to start GDB server"
that happen (it seems) when reconnecting the M4 core. This forces you to physically disconnect the debugger (at least I did not find another solution). Meanwhile, the IDE tries to reconnect and causes a series of "halt" of the M7 core (about twenty) before stabilizing.
To this is added a kind of general confusion which in my opinion makes debugging low-level programs... acrobatic and taxing for my nervous health.
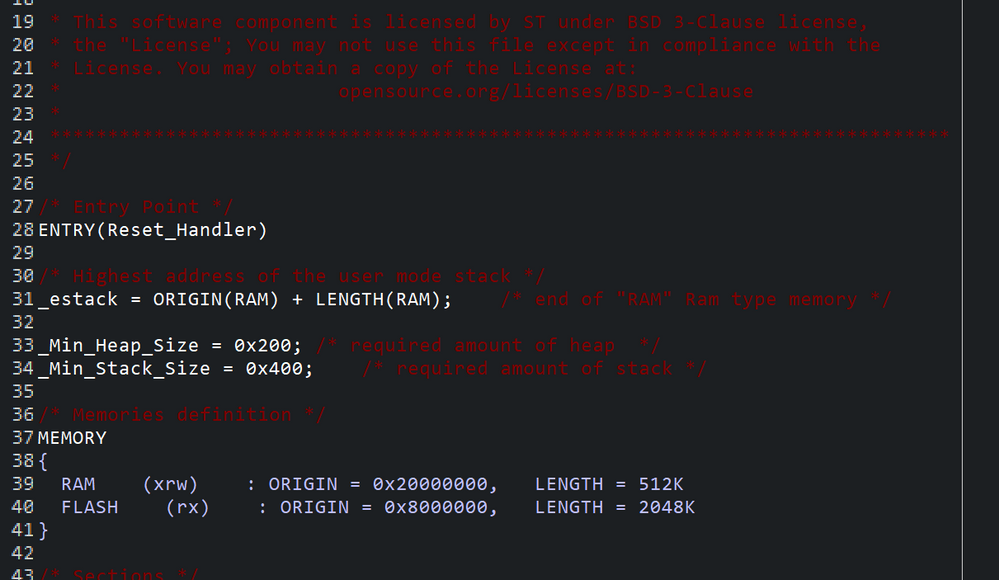
By the way, do you know how we change the colors of the files associated with the linker (* .ld). When I use a colorization in "night" mode, the flashcard files become unreadable and I didn't find where, in "preference->", we could change that ...
Best regards,
Jean-Louis
- Mark as New
- Bookmark
- Subscribe
- Mute
- Subscribe to RSS Feed
- Permalink
- Email to a Friend
- Report Inappropriate Content
2020-09-19 04:56 PM
> This is the first time that I seriously use Eclipse (I know, Keil IAR, Segger ...), it is a bit trying experience to do hard debugging.
It's always a journey learning a new IDE.
> The solution you recommend for connecting does not work for me quite properly. When you connect the debugger, the processor is stopped for a few ms, which is annoying when you work with inductive devices.
I'm not sure about the CPU halting on debug. You're running dual-core so things might be a little more difficult to get working correctly. I don't know if the halting is a fundamental limitation of ST-Link or a deficiency in the implementation. I do know there is a setting to have timers keep running timers while the cpu is halted. If that would solve the problem, perhaps you could look into that.
> By the way, do you know how we change the colors of the files associated with the linker (* .ld).
I use dark mode as well and the LD file is readable, but not the greatest color scheme choice. I've just learned to ignore it since I don't edit the linker file very often. Is your actually unreadable?
- Doubt related loading code and debugging with STM32 WL55JC controller in STM32CubeIDE (MCUs)
- STM32CubeIDE crashes - Problem: EXC_BAD_ACCESS (SIGABRT) in STM32CubeIDE (MCUs)
- SelfUpgrade Update. Trying to restore. in STM32CubeIDE (MCUs)
- STM32CubeIDE 1.11.2 Headless build freezes for 20 seconds after "Build Finished" in STM32CubeIDE (MCUs)
- STM32CubeIDE Serial Port Connection in STM32CubeIDE (MCUs)
