- STMicroelectronics Community
- STM32 MCUs Software development tools
- STM32CubeIDE (MCUs)
- How to debug interrupt ISR and FreeRTOS tasks in S...
- Subscribe to RSS Feed
- Mark Topic as New
- Mark Topic as Read
- Float this Topic for Current User
- Bookmark
- Subscribe
- Mute
- Printer Friendly Page
How to debug interrupt ISR and FreeRTOS tasks in STM32CubeIDE?
- Mark as New
- Bookmark
- Subscribe
- Mute
- Subscribe to RSS Feed
- Permalink
- Email to a Friend
- Report Inappropriate Content
2020-07-07 09:28 PM
I have tried to follow a youtube video https://www.youtube.com/watch?v=TH2aCiU9Jyo (Analyzing FreeRTOS Application using SEGGER SystemView Trace software : Part 1 from Fastbit Embedded Brain Academy ) to try and debug the ISR from SEGGER SystemView Trace software.
The process require one to flash STLink firmware with a JLink Compatible Firmware, afterwards use Segger SystemVIew to record and view the the hardware interrupts/ FreeRtos Task in realtime. And one should also include the RTT library into their project and add relevant code into their source file.
I want to know if this is the correct approach for debugging ISR and Tasks ? I couldn't find any guides on how to achieve this in STM32CubeIDE, most guides are for Keil,Eclipse or Atollic only! And I do not want to switch to another IDE as my code currently works well with ToughGFX Designer, STM32CubeIDE.
Can anyone provide the standard approach for debugging ISR and Tasks in STM32CubeIDE with/without Segger SystemView to allow amateur programmers such as myself the opportunity to debug their program?
Thank you very much for your time!
- Labels:
-
FreeRTOS
-
STM32CubeIDE
- Mark as New
- Bookmark
- Subscribe
- Mute
- Subscribe to RSS Feed
- Permalink
- Email to a Friend
- Report Inappropriate Content
2020-07-11 01:50 AM
Standard approach is to use breakpoints, watch variables and some printf() style logging. The methods you describe are good but more like an advanced level and for performance profiling.
No debugging will help if you don't know the fundamental concepts of interrupt and thread safe programming. But, when you do know it, then the standard breakpoints and watch variables are good enough even for pretty complex projects.
- Mark as New
- Bookmark
- Subscribe
- Mute
- Subscribe to RSS Feed
- Permalink
- Email to a Friend
- Report Inappropriate Content
2020-07-12 04:43 AM
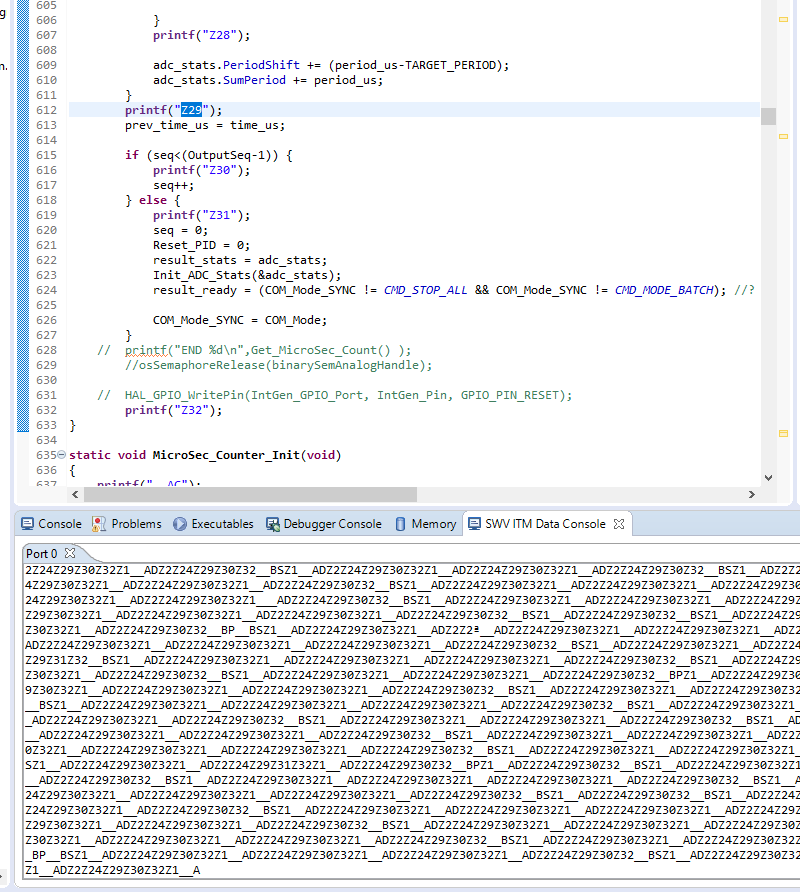
Hi , thank you very much for your reply. I have been using this method to debug my program. My program is quite big, i tried my best to put a short printf function such as printf("_A1") or print("_B20") in every functions inside main.c. I will then use SWV ITM Data Console and check the printf output of the program after running for a few seconds. An data console would look like the following
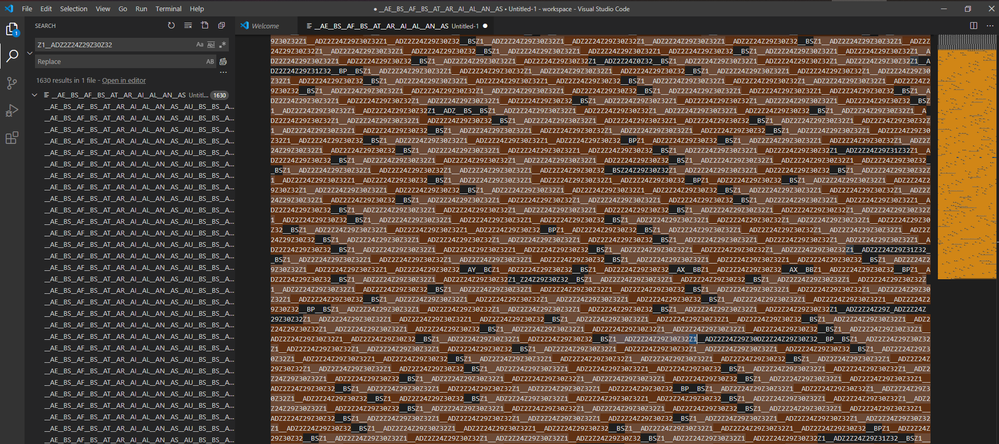
I then copy paste the console output, and put into Visual Studio to find irregular pattern and try to deduce the cause
For example, the correct sequence should be Z1__ADZ2Z24Z29Z30Z32, but the sequence became Z1_Z24Z29Z30Z32, a function with printf("_AD") is not fired at all.
Another example is Z1__ADZ2Z24Z29Z30DZ2Z24Z29Z30Z32, a function with printf("Z2") repeats itself twice, which shouldn't be possible , unless something have messed with the program counter, which is definitely not done by me intentionally. The other possible cause is the freeRtos is messing with the stack pointers to make sure that all task's are fired at the right time interval etc. (i'm stuck in this part for few weeks already, can't solve the bug )
Overall, this is really hard for me to debug manually, and would like to see if SEGGER SystemView Trace could help me trace where the issue is at.
- STMCubeIDE V1.15.0 Build Errors in STM32CubeIDE (MCUs)
- UART cosfiguration directly with registers, NUCLEO-H563ZI board in STM32CubeIDE (MCUs)
- ADC with DMA in scan mode is not resulting in call to HAL_ADC_ConvCpltCallback in STM32CubeIDE (MCUs)
- STM32F4 libusb-win32 with FREERTOS problem in STM32CubeIDE (MCUs)
- Adding new c source files to my project and navigating through them in STM32CubeIDE (MCUs)

