- STMicroelectronics Community
- STM32 MCUs Software development tools
- STM32CubeMonitor (MCUs)
- How to use the CubeMonitor in snapshot mode withou...
- Subscribe to RSS Feed
- Mark Topic as New
- Mark Topic as Read
- Float this Topic for Current User
- Bookmark
- Subscribe
- Mute
- Printer Friendly Page
How to use the CubeMonitor in snapshot mode without trigger supported?
- Mark as New
- Bookmark
- Subscribe
- Mute
- Subscribe to RSS Feed
- Permalink
- Email to a Friend
- Report Inappropriate Content
2020-03-17 08:08 PM
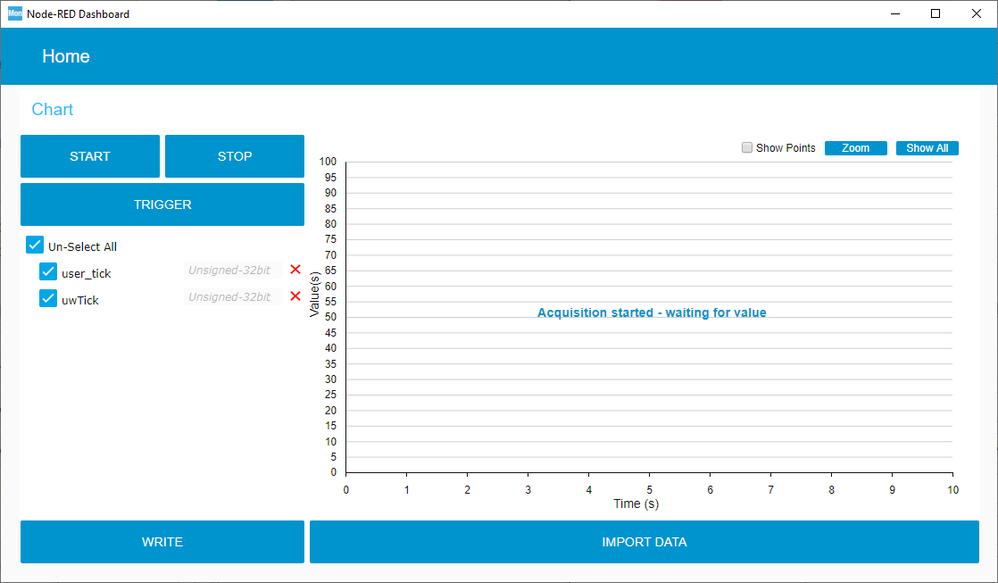
I instrumented the code with the supplied code, and it works fine in STM Studio, but when used in CubeMonitor, after started, the dashbord just displays 'Acquisition started, waiting for value'. I've checked the data flow from STLink and found that only 'x' value present in the data payload, but without 'y' value.
Is there a way to trigger the data sample manually? Or supporting trigger is mandatory in snapshot mode?
Solved! Go to Solution.
- Labels:
-
STM32CubeMonitor
Accepted Solutions
- Mark as New
- Bookmark
- Subscribe
- Mute
- Subscribe to RSS Feed
- Permalink
- Email to a Friend
- Report Inappropriate Content
2023-09-27 06:34 AM
No update since a while, closing the post.
- Mark as New
- Bookmark
- Subscribe
- Mute
- Subscribe to RSS Feed
- Permalink
- Email to a Friend
- Report Inappropriate Content
2020-03-18 01:42 AM
Dear SZENG.1,
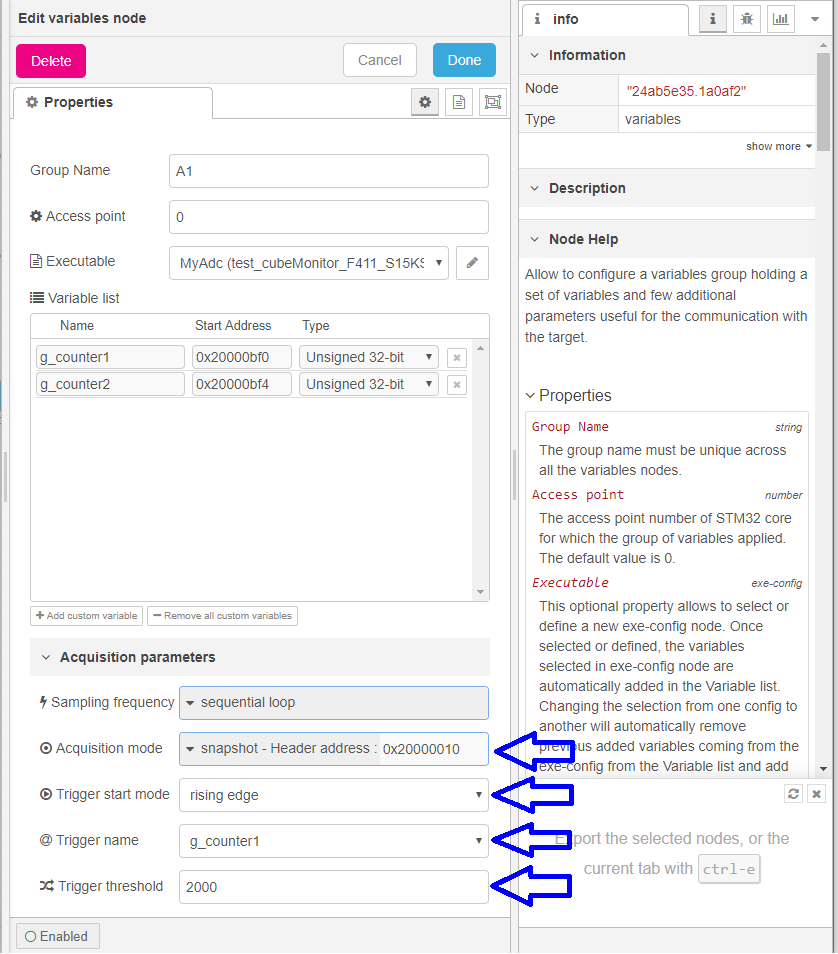
Did you configure the node "variables" as expected ?
You have to :
-> select your monitored variables from the executable file
->select the snapshot mode (and verify that header address is detected )
-> select ( if you need it, it's not mandatory) a trigger variable and additional parameters of triggering ( value and start mode ).
Please come back to me if it's still not working.
Landry
- Mark as New
- Bookmark
- Subscribe
- Mute
- Subscribe to RSS Feed
- Permalink
- Email to a Friend
- Report Inappropriate Content
2020-03-18 02:04 AM
Hi Landry,
Here is the situation:
The trigger function in the firmware code is not enabled, as it's not required and for saving RAM and ROM space;
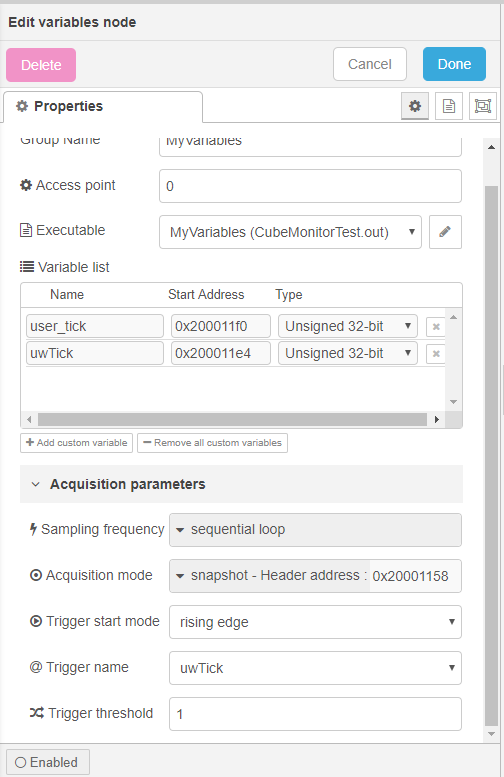
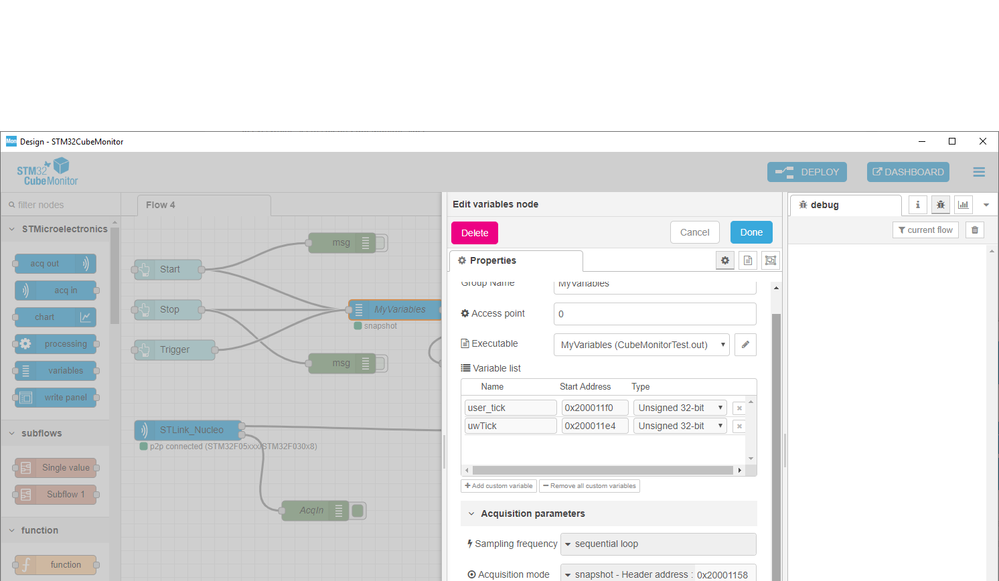
The variables should have been configured correctly:
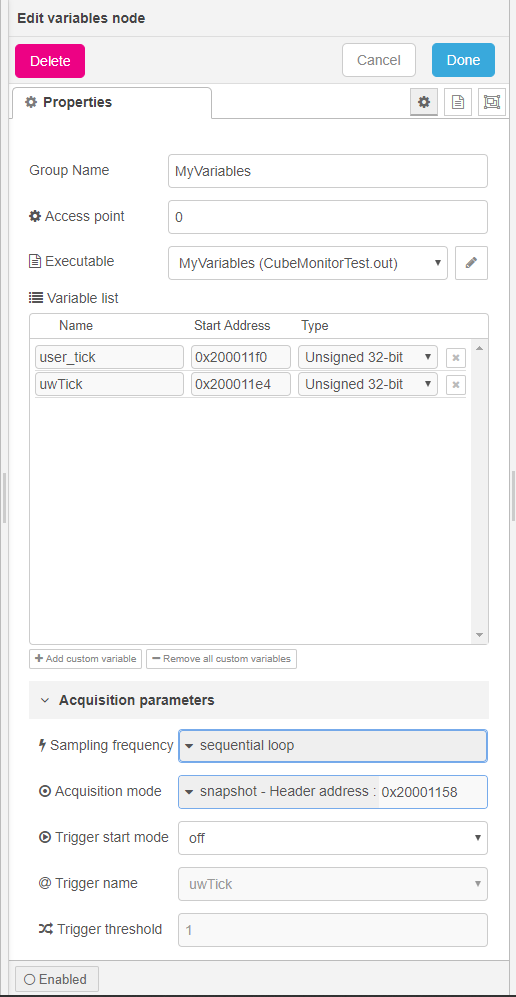
While, if trigger has been selected other than 'off' like below:
the acq in & out will show an error after started:
- Mark as New
- Bookmark
- Subscribe
- Mute
- Subscribe to RSS Feed
- Permalink
- Email to a Friend
- Report Inappropriate Content
2020-03-18 02:23 AM
-Your node "variables" configuration is correct .
-In snapshot mode, the first point sent ( to set the first timestamp ) is an x only value, so this is also correct.( it means that the start is taking into account ).
-When you don't manage the trigger mode in your embedded application , the message "The trigger mode is not supported" is also correct.
So everything seems ok on CubeMonitor side.
Can you link the error output of your "acquisition in" node to debug node to see if you have some messages available ?
thank you
- Mark as New
- Bookmark
- Subscribe
- Mute
- Subscribe to RSS Feed
- Permalink
- Email to a Friend
- Report Inappropriate Content
2020-03-18 02:34 AM
Dear Landry,
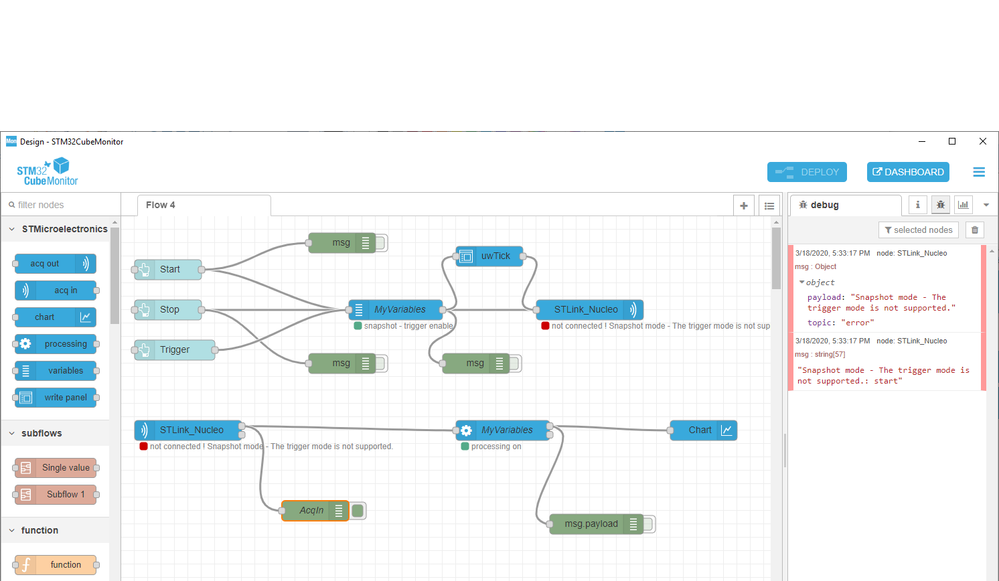
FYI:
- Mark as New
- Bookmark
- Subscribe
- Mute
- Subscribe to RSS Feed
- Permalink
- Email to a Friend
- Report Inappropriate Content
2020-03-18 02:45 AM
Sorry i was not clear,
remove the trigger in the variables node configuration. Then link the debug node to the second output of the node "acquisition in" (the one called "error").
- Mark as New
- Bookmark
- Subscribe
- Mute
- Subscribe to RSS Feed
- Permalink
- Email to a Friend
- Report Inappropriate Content
2020-03-18 02:53 AM
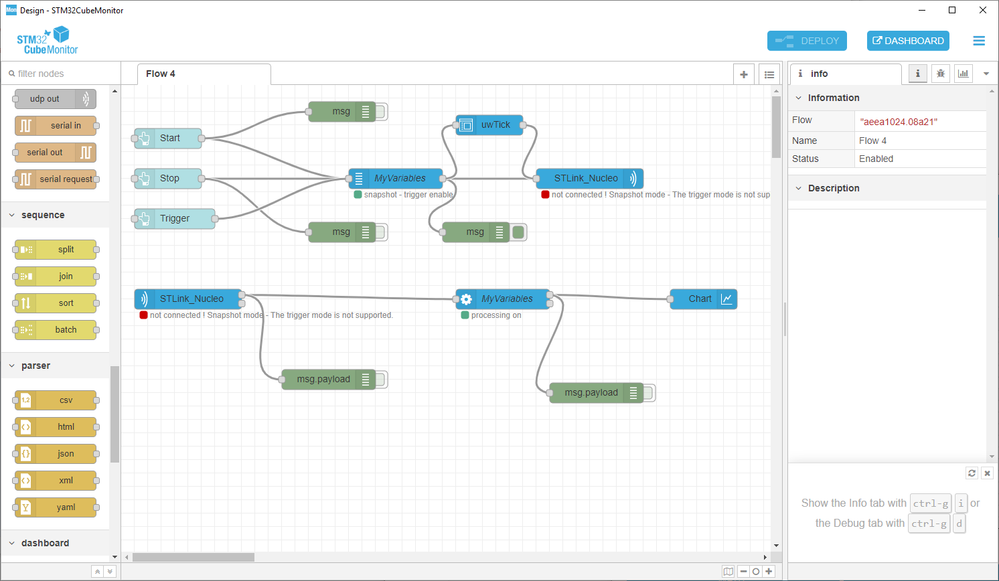
Do you mean like this:
No any output, which means no error, right?
- Mark as New
- Bookmark
- Subscribe
- Mute
- Subscribe to RSS Feed
- Permalink
- Email to a Friend
- Report Inappropriate Content
2020-03-18 02:58 AM
did you start an acquisition ?
- Mark as New
- Bookmark
- Subscribe
- Mute
- Subscribe to RSS Feed
- Permalink
- Email to a Friend
- Report Inappropriate Content
2020-04-06 01:11 AM
Hi SZENG.1,
The acquisition doesn’t start because you embedded application you are using (dataAcq files) was modified. The Size of buffer is defined with the formula: #define SNP_TRC_BUFFER_SIZE (50*(SNP_TRC_NB_MAX_WORD_VAR+1)) and unfortunatly Stm32cubemonitor doesn't allow modification on it. If the default buffer size is not enough large, I advice the increase the parameter SNP_TRC_NB_MAX_WORD_VAR (defined at 10 by default).
- Mark as New
- Bookmark
- Subscribe
- Mute
- Subscribe to RSS Feed
- Permalink
- Email to a Friend
- Report Inappropriate Content
2020-04-10 08:09 AM
where do I go to set the variables?
