- STMicroelectronics Community
- STM32 MCUs Software development tools
- STM32CubeIDE (MCUs)
- Question on STM32 USB libraries
- Subscribe to RSS Feed
- Mark Topic as New
- Mark Topic as Read
- Float this Topic for Current User
- Bookmark
- Subscribe
- Mute
- Printer Friendly Page
Question on STM32 USB libraries
- Mark as New
- Bookmark
- Subscribe
- Mute
- Subscribe to RSS Feed
- Permalink
- Email to a Friend
- Report Inappropriate Content
2020-01-23 03:39 PM
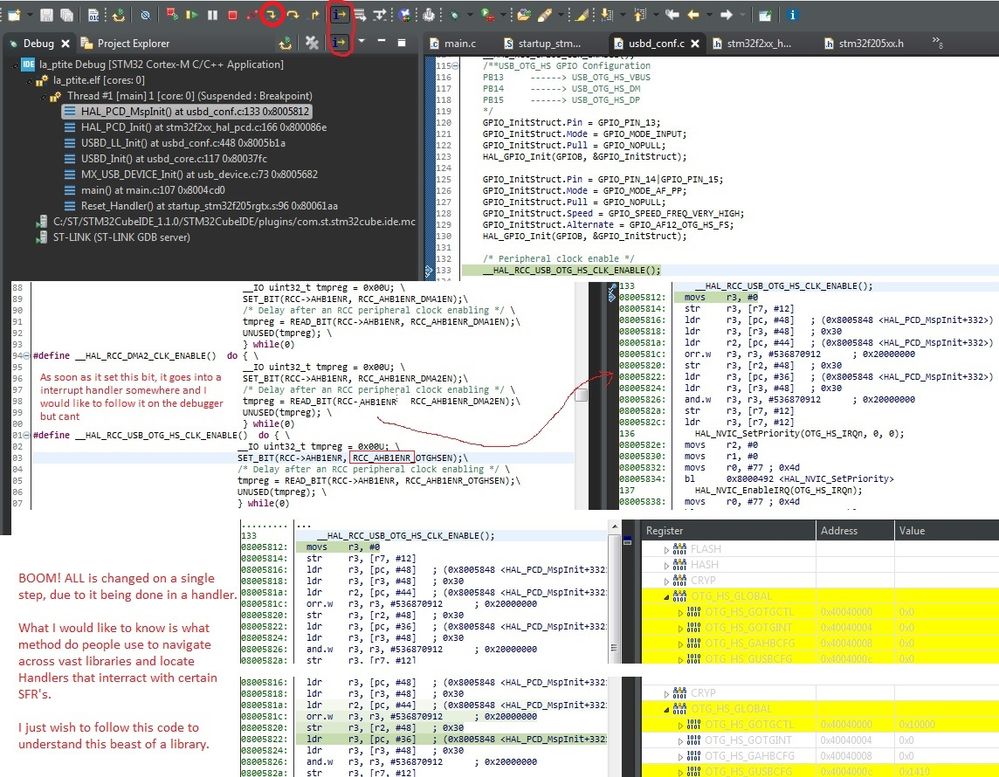
So I notice this uncomfortable feeling of not knowing WTF is going on when I single step through ALL the config, trying to make sense of all this BS stepping to setup the registers. Since most of this stuff I soon wont care about exept their 1 or 2 functions, but the USB I need to study a bit, yet when it gets to this peripheral, it sets it up in a Handler, and I cant see the relationship going between setup page and SFR's, wich I like to do.
How do people know where to check for Handlers. Now theres a handler but its lost somewhere...
I wanna see where this Interrupt is enabled for the USB clock in the first place, I know that as soon as the CLK bit is set it trips, but thats because its enabled.
I wanna practice and watch over the INTERRUPT ENABLE registers for such and such peripherals, is there there a "tree like" diagram for all the possible interrupt names and their peripherals for each family??
BTW, I dont see why people complain about this IDE its quite fast and stable with hardware reset and setup with "connect on reset". using ST-link V3
- Labels:
-
STM32CubeIDE
- Mark as New
- Bookmark
- Subscribe
- Mute
- Subscribe to RSS Feed
- Permalink
- Email to a Friend
- Report Inappropriate Content
2020-01-23 05:18 PM
Anybody how I can watch my event handlers on STM32CUBEIDE ??
From this blogpost I cant understand.
- Mark as New
- Bookmark
- Subscribe
- Mute
- Subscribe to RSS Feed
- Permalink
- Email to a Friend
- Report Inappropriate Content
2020-01-24 07:47 AM
So in the breakpoints view, by clicking on the little inverted triangle on the right corner...
https://community.nxp.com/thread/389027
Well it seems like in my case I cant configure it to stop on a write or read.
Perhaps I am in this category?
Watchpoints can be configured to halt on a Read (or Load), Write (or Store), or both. Since watchpoints 'watch' accesses to memory, they are suitable for tracking accesses to global or static variables, and any data accesses to memory including those to memory mapped peripherals.
Note: Due to the way watchpoints are implemented, any monitored access will be performed by the CPU before a halts occurs (unlike instruction breakpoints - which halt the CPU before the underlying instruction executes). When a watchpoint is hit you will see some 'skid' beyond the instruction that performed the watched data access. If the instruction after the data access changes program flow (e.g. a branch or function return), then the IDE may not show the instruction or statement that caused the CPU to halt.
- Mark as New
- Bookmark
- Subscribe
- Mute
- Subscribe to RSS Feed
- Permalink
- Email to a Friend
- Report Inappropriate Content
2020-01-24 11:41 PM
- Mark as New
- Bookmark
- Subscribe
- Mute
- Subscribe to RSS Feed
- Permalink
- Email to a Friend
- Report Inappropriate Content
2020-01-25 07:27 AM
hello?
