- STMicroelectronics Community
- STM32 MCUs Software development tools
- STM32CubeIDE (MCUs)
- STM32CubeIDE: How to enter commands in the debug c...
- Subscribe to RSS Feed
- Mark Topic as New
- Mark Topic as Read
- Float this Topic for Current User
- Bookmark
- Subscribe
- Mute
- Printer Friendly Page
STM32CubeIDE: How to enter commands in the debug configuration as in TrueStudio?
- Mark as New
- Bookmark
- Subscribe
- Mute
- Subscribe to RSS Feed
- Permalink
- Email to a Friend
- Report Inappropriate Content
2019-06-06 05:58 AM
Hello,
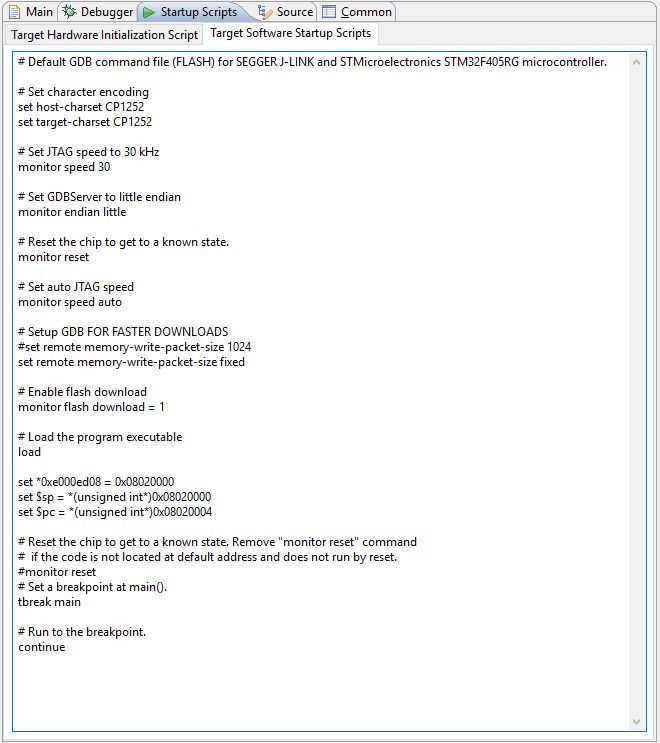
I used the following "Target Software Startup Script" in the debug configuration in Atollic TrueStudio (this is necessary since we're using a bootloader and our application binary which I would like to debug is not placed at the beginning of the STM32 flash):
How to enter this in STM32CubeIDE?
I would really need to debug my firmware, but can't figure out how to do the required settings...
Any ideas?
Kind regards,
Markus
Solved! Go to Solution.
- Labels:
-
DEBUG
-
STM32CubeIDE
Accepted Solutions
- Mark as New
- Bookmark
- Subscribe
- Mute
- Subscribe to RSS Feed
- Permalink
- Email to a Friend
- Report Inappropriate Content
2019-06-21 01:38 AM
I just solved the issue...
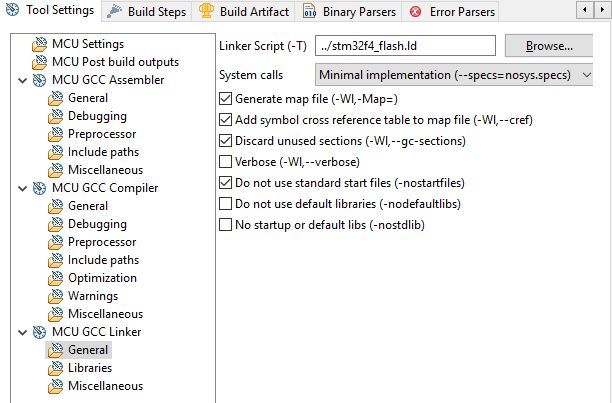
It turned out that the linker setting "-Wl,--cref" (Add symbol cross reference table to map file) was missing. Checking the corresponding box in the linker settings, debugging now also works also with ST-Link in CubeIDE!
Kind regards,
Markus
- Mark as New
- Bookmark
- Subscribe
- Mute
- Subscribe to RSS Feed
- Permalink
- Email to a Friend
- Report Inappropriate Content
2019-06-06 06:05 AM
When I use e.g.
x Load image
Use project binary
x Load symbols
Use project binary
and under "Run commands":
--
set *0xe000ed08 = 0xC000
set $sp = *(unsigned int*)0xC000
set $pc = *(unsigned int*)0xC004
set *0xE0042004 = (*0xE0042004) | 0x7
tbreak main
continue
---
the binary is flashed correctly to the MCU, but then the (ST-Link V2) debugger connection is lost:
---
Download verified successfully
Error! Failed to read target status
Debugger connection lost.
Shutting down...
---
Any ideas?
Kind regards,
Markus
- Mark as New
- Bookmark
- Subscribe
- Mute
- Subscribe to RSS Feed
- Permalink
- Email to a Friend
- Report Inappropriate Content
2019-06-11 12:14 AM
Is this a new project in STM32CubeIDE or migrated?
Maybe you can consider adding in the scripts line by line and see which one causes your connection to crap out?
- Mark as New
- Bookmark
- Subscribe
- Mute
- Subscribe to RSS Feed
- Permalink
- Email to a Friend
- Report Inappropriate Content
2019-06-11 12:33 AM
Hello,
this is a project from Atollic TrueStudio migrated to STM32CubeIDE.
I will try adding the scripts line by line.
Kind regards,
Markus
- Mark as New
- Bookmark
- Subscribe
- Mute
- Subscribe to RSS Feed
- Permalink
- Email to a Friend
- Report Inappropriate Content
2019-06-11 12:40 AM
It seems setting stack pointer and program counter makes problems:
Failed to execute MI command:
set $sp = *(unsigned int*)0xC000
Error message from debugger back end:
Selected thread is running.
Failed to execute MI command:
set $pc = *(unsigned int*)0xC004
Error message from debugger back end:
Selected thread is running.
So my question is how I can make these settings with the STM32CubeIDE dialog.
Kind regards,
Markus
- Mark as New
- Bookmark
- Subscribe
- Mute
- Subscribe to RSS Feed
- Permalink
- Email to a Friend
- Report Inappropriate Content
2019-06-11 01:02 AM
set *0xe000ed08 = 0xC000
set $sp = *(unsigned int*)0xC000
set $pc = *(unsigned int*)0xC004
I have the above 3 commands in my initialization commands and it seems to run fine.
- Can I check that if you don't have any of your initialization commands, your debugger connection is ok?
- If you just put in the above 3 commands only, do you still face the same connection problem?
- Mark as New
- Bookmark
- Subscribe
- Mute
- Subscribe to RSS Feed
- Permalink
- Email to a Friend
- Report Inappropriate Content
2019-06-11 01:42 AM
Hello,
I now put these commands in the "Initialization Commands" field (previously used the "Run commands" field) and now I don't get the error messages any more. So thanks for the hint!
However, now execution is always trapped in "Default_Reset_Handler" and doesn't get out of the loop
for(pulDest = &_sdata; pulDest < &_edata; )
{
*(pulDest++) = *(pulSrc++);
}
Trying to figure out what is missing here...
Kind regards,
Markus
- Mark as New
- Bookmark
- Subscribe
- Mute
- Subscribe to RSS Feed
- Permalink
- Email to a Friend
- Report Inappropriate Content
2019-06-11 01:50 AM
Glad to help. 🙂
- Mark as New
- Bookmark
- Subscribe
- Mute
- Subscribe to RSS Feed
- Permalink
- Email to a Friend
- Report Inappropriate Content
2019-06-11 03:06 AM
Using the SEGGER J-Link, it works.
For some reason, using the same startup settings, it doesn't work with the ST-Link v2 showing the followin error:
---
Download verified successfully
Error! Failed to read target status
Debugger connection lost.
Shutting down...
---
Kind regards,
Markus
- Mark as New
- Bookmark
- Subscribe
- Mute
- Subscribe to RSS Feed
- Permalink
- Email to a Friend
- Report Inappropriate Content
2019-06-11 03:25 AM
Your initial posts include some speed settings. I didn't have to do any speed settings for ST-Link to work.
Did you choose the Debug probe to be ST-Link?
- Does STM32CubeIDE and Azure RTOS properly support Sprintf? in STM32CubeIDE (MCUs)
- UART cosfiguration directly with registers, NUCLEO-H563ZI board in STM32CubeIDE (MCUs)
- Error: Operation exceed memory limits - STM32G47x/G48x in STM32CubeProgrammer (MCUs)
- AZRTOS and FTP support in STM32CubeIDE (MCUs)
- CMake error when building STM32 project outside STM32CubeIde in STM32CubeIDE (MCUs)

