- STMicroelectronics Community
- STM32 MCUs Software development tools
- Other tools (MCUs)
- Atollic debug: Failure at line:37 in 'Target Softw...
- Subscribe to RSS Feed
- Mark Topic as New
- Mark Topic as Read
- Float this Topic for Current User
- Bookmark
- Subscribe
- Mute
- Printer Friendly Page
Atollic debug: Failure at line:37 in 'Target Software Startup Scripts'
- Mark as New
- Bookmark
- Subscribe
- Mute
- Subscribe to RSS Feed
- Permalink
- Email to a Friend
- Report Inappropriate Content
2018-12-06 09:58 AM
I'm using Atollic 9.1 with a Cube-generated project on F413 Nucleus board. When I debug (clicking on green bug icon), I get a message that debug failed, with debug context stopped wherever it stopped in the previous debug session. If I click on the green 'continue' arrow, debugging then stops at the breakpoint in 'main' as expected. What's going on? Did not see this problem with the previous project using F407 (F4 Discovery board). Here's the error it pops:
- Labels:
-
Bug-report
-
TrueSTUDIO
- Mark as New
- Bookmark
- Subscribe
- Mute
- Subscribe to RSS Feed
- Permalink
- Email to a Friend
- Report Inappropriate Content
2018-12-11 05:30 AM
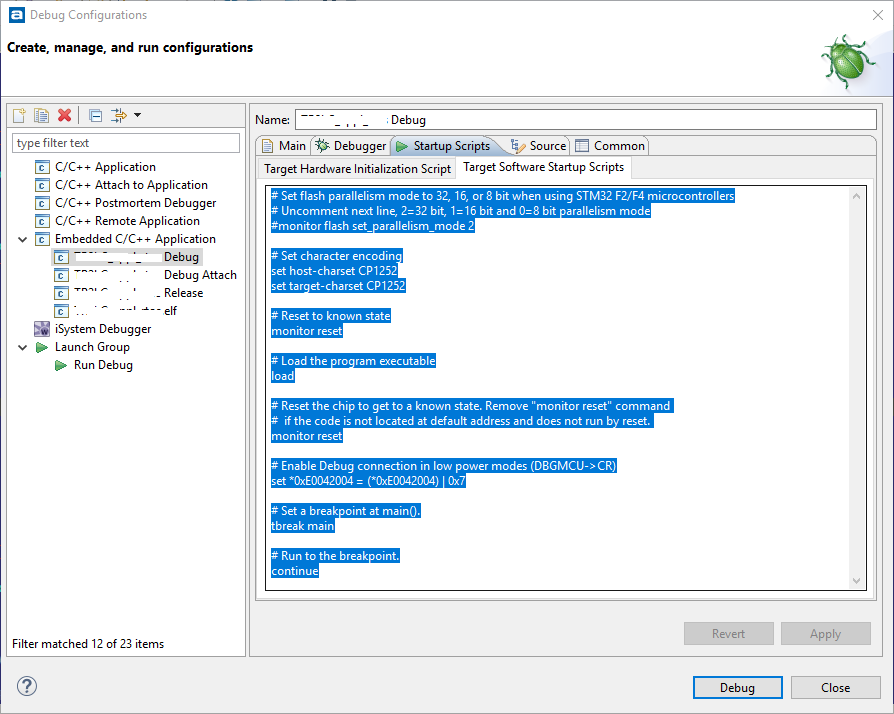
In Atollic, go to Run->Debug Configurations
Under Embedded C/C++ Applications choose your debug configuration, then go to
Startup Scripts->Target Software Startup Scripts
There you will find script that looks like this.
Find line 37, and
- correct line (if you know what is wrong), or
- comment out line (with #, if you do not know what is wrong)
- Mark as New
- Bookmark
- Subscribe
- Mute
- Subscribe to RSS Feed
- Permalink
- Email to a Friend
- Report Inappropriate Content
2019-01-18 10:33 AM
@stikla - Unfortunately it is failing on the "continue" (with error: cannot execute this command without a live selected thread). This seems to be a well-known problem at least for Segger users, and there seem to be some GDB patches related to the problem. Erich recommended adding a wait, but that didn't work. Any other ideas? Thanks!
- Integrated jxBrowser not working in STM32CubeIDE (MCUs)
- clion uses arm gcc to compile code generated from cubemx file error in STM32CubeMX (MCUs)
- STM32L452CE CubeIDE Linker script causes hardfault inside Reset_Handler in STM32CubeIDE (MCUs)
- Problem with download elf file in boot mode when using RAM2 in STM32CubeProgrammer (MCUs)
- One MCU type, multiple functionalities, one hex file in STM32CubeIDE (MCUs)

