Turn on suggestions
Auto-suggest helps you quickly narrow down your search results by suggesting possible matches as you type.
Showing results for
- STMicroelectronics Community
- STM32 MCUs
- STM32 MCUs products
- STM32F429 - cannot view external memory in Eclipse...
Options
- Subscribe to RSS Feed
- Mark Topic as New
- Mark Topic as Read
- Float this Topic for Current User
- Bookmark
- Subscribe
- Mute
- Printer Friendly Page
STM32F429 - cannot view external memory in Eclipse memory pane.
Options
- Mark as New
- Bookmark
- Subscribe
- Mute
- Subscribe to RSS Feed
- Permalink
- Email to a Friend
- Report Inappropriate Content
2014-10-24 12:19 PM
Posted on October 24, 2014 at 21:19
I have been utilizing Eclipse IDE using GNU tool chain to develop and debug my STM32F429 based project.
The target platform has an external SDRAM memory which configured and managed by the MCU's FMC unit. Even though the SDRAM operation is tested for its operation, the Eclipse memory pane cannot display the contents of external memory addresses when debugging with the arm gdb tools. The contents of the memory addresses are shown as ???????. When properties of the memory window is viewed the Readable and Writeable properties are set as ''false''. I am not sure whether this is Eclipse issue, or caused by gdb settings. I thought memory properties are gathered through linker scripts. Has anyone encountered the same problem and find a solution? How to change the eclipse memory window properties, any thought?Thanks.ps. I am running Eclipse with Kepler Service Release 2, Build id. 20140224-0627 on Ubuntu 12.04 environment. Version number of the ''arm-none-eabi-gdb'' is 7.6.0.20140228-cvs.
2 REPLIES 2
Options
- Mark as New
- Bookmark
- Subscribe
- Mute
- Subscribe to RSS Feed
- Permalink
- Email to a Friend
- Report Inappropriate Content
2014-10-24 04:59 PM
Posted on October 25, 2014 at 01:59
Ok, but you're confusing a couple of concepts here.
Linker scripts tell the linker how to arrange data within an executable image/space. Initialization code in the firmware to stand up the external bus is not helpful to the debugger when it's taken control of the hardware at reset. None of this stuff is functional, and is board specific. The debugger likely has it's own start up script, or memory map, for the STM32Fxxx chips, this may need to be further augmented for specific boards to a) describe the address/size of memory arenas, and b) to configure the external buses, pins, controller and hardware to permit access to those resource(s).http://www.sourceware.org/gdb/onlinedocs/gdb.html#Memory-Map-Format
I'm not a GDB user, it may also be able to infer information contained in .ELF object files too. You'll have to read up about, and research, the tool chain you have chosen.
Tips, Buy me a coffee, or three.. PayPal Venmo
Up vote any posts that you find helpful, it shows what's working..
Up vote any posts that you find helpful, it shows what's working..
Options
- Mark as New
- Bookmark
- Subscribe
- Mute
- Subscribe to RSS Feed
- Permalink
- Email to a Friend
- Report Inappropriate Content
2015-01-07 01:36 PM
Posted on January 07, 2015 at 22:36 Here is the snapshot of the gdb traces when info mem and set mem ... commands are run:
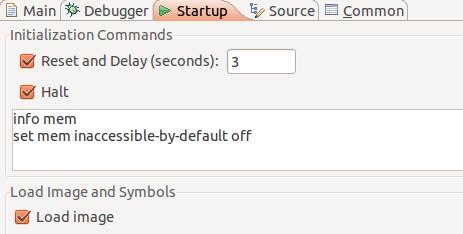
I have been using a quick and dirty solution to view the external memory in my gdb debugger now. Those who compile and debug their STM32F4 MCU in Linux Eclipse based gcc environment, can follow the steps below:
- In Eclipse IDE open Debug Configurations under Run menu.- Select your debugging configuration under ''GDB Hardware Debugging''- Select Startup configuration on the right pane and enter the following commands :info memset mem inaccessible-by-default off- Save your changes and now you can access to those memory spaces which the target doesn't define them explicitly for the gdb.. The first line (info mem) prints out the mem view of the gdb at the start of the debug session (output in the gdb console). Here is the snapshot of the gdb traces when info mem and set mem ... commands are run:
118,926 (gdb)
118,926 14info mem118,926 &''info mem\n''118,926 ~''Using memory regions provided by the target.\n''118,926 ~''Num Enb Low Addr High Addr Attrs \n''118,926 ~''0 y \t0x00000000 0x00200000 ro nocache \n''118,926 ~''1 y \t0x08000000 0x08200000 flash blocksize 0x4000 nocache \n''118,926 ~''2 y \t0x1fff0000 0x1fff7800 ro nocache \n''118,926 ~''3 y \t0x1ffff800 0x1ffff810 ro nocache \n''118,926 ~''4 y \t0x20000000 0x20030000 rw nocache \n''118,926 ~''5 y \t0x40000000 0x5fffffff rw nocache \n''118,926 ~''6 y \t0xe0000000 0xffffffff rw nocache \n''118,926 14^done118,926 (gdb) 118,927 15set mem inaccessible-by-default off118,929 &''set mem inaccessible-by-default off\n''118,929 =cmd-param-changed,param=''mem inaccessible-by-default'',value=''off''118,930 15^done
Related Content
- Data is not stored in the FIFO when FSEL is 1 in STM32 MCUs products
- How to solve HardFault_Handler problem at debugging? in STM32CubeIDE (MCUs)
- FLASH data cannot be read as expected using Memory Mapped Mode in STM32 MCUs products
- STM32H573 I2S audio clock problem in STM32 MCUs products
- 16 bit ADC interface in STM32 MCUs Embedded software